
Better Care Through Understanding the Customer Not Just the Patient
By Jim Dolstad, Justin Hartmann and Craig Cartossa
Health Watch, December 2021

As actuaries in health care, we spend most of our time focused on reviewing claims, enrollment and clinical data. That information is captured while patients are in health care facilities. Yet most people spend only a small fraction of their time in these facilities. Our health behaviors outside the health system, the social and economic factors we live with, as well as the physical environment we live in also impacts health care costs—some studies suggest up to 80 percent of those costs.[1] If we were to look at a member more holistically, as a customer, it might enable the industry to improve care and the associated outcomes.
What types of data exist outside a health plan or provider’s walls that would enable us to develop a more holistic view of the member? At a high level, there are three types of data sources that can help inform us of a member’s needs and wants.
The first two are publicly available data that focus on social and economic factors such as where a member lives and community factors. Social and economic factors include such things as socioeconomic status (obviously), percentage of disconnected youth* and education level. Community factors include crime rates, access to clinical care and access to food.
The third level of data gets down to the member level through consumer data vendors. Information may include things like homeowner status, average online spending and marital status, to name a few. These data and any models developed from them should be used with caution, comply with actuarial standards of practice and be tested to avoid any potential biases.
Within the ICD-10 codes is a series of approximately 150 “Z codes.” These codes are used for many purposes, including more than 70 codes for capturing social determinants of health (SDOH). These are designed to collect a wide range of data about a member, including housing and food challenges, family stress, occupational exposure to risk factors, substance abuse and myriad other factors.
Despite the positive intent and potential of the information, it’s only available on about 3–5 percent of members. Even when the information is provided, it’s often incomplete.
Fortunately, using all the information noted in this article, we can build predictive models that develop likelihoods at the member level for factors like social isolation, housing insecurity, financial insecurity and food insecurity. We can also predict behaviors such as health ownership and propensity to engage in care management programs. At the macro level, this type of information enables actuaries to develop better products and plan designs to meet the needs of their customers.
This article will focus on a few different use cases. We’ll explore the value of leveraging this type of data to understand the needs and wants of a member and drive improved clinical, financial and operational performance.
*Disconnected youth are 16- to 24-year-olds who are neither working nor in school.
Improvements in Completion of Annual Wellness Visits
Health plans that receive risk-adjusted premiums, such as Medicare Advantage organizations, have a financial incentive to ensure that they have a complete and accurate risk profile of their membership, documented through ICD-10 codes resulting from encounters with providers. Health plans can leverage annual wellness visits to get a full disease profile of their members to improve risk-adjusted premiums. This also reduces future claims expense by diagnosing patient conditions earlier when they can be easier to treat.
The benefits of an annual wellness visit for the patient are obvious. They receive a health screening that can lead to better health outcomes and help them live a healthier life. Given the benefits and the fact that annual wellness visits are covered by Medicare with no out-of-pocket costs, it’s surprising that most health plans find it difficult to complete annual wellness visits for their members. In some situations, health plans have even offered incentives to providers that are able to complete these visits for their members.
This is why understanding the patient holistically can benefit the health plan as well as the member, while increasing the number of annual wellness visits completed each year. As a preventive service, annual wellness visits are not initiated by any sort of medical event or symptom. That means analyzing a patient’s medical history will tell us very little about their likelihood to seek such a visit with a provider.
What are the consumer characteristics of those who have not completed an annual wellness visit? Consider two different people, each with an unknown medical history. The first lives alone in a rural area of East Texas. Her closest relative lives four hours away in Dallas, and the closest doctor’s office is one hour away.
The second person lives with his spouse in Long Island, has a sister who lives 45 minutes away in Queens, and has five different in-network providers within a 20-minute drive from his house. Without knowing anything else about these two consumers, it’s clear that the first is significantly less likely to make a trip to the physician’s office for a preventive visit than the second.
When we look at improving completion of annual wellness visits, we look at what barriers to care access exist and how we can mitigate them by considering SDOH. Taking the preceding example of the two patients, the first is significantly more socially isolated than the second. That means the first has fewer social connections she can count on. She may not have anyone she can ask for a ride to the doctor’s office or to watch her kids while she completes her annual wellness exam.
While looking at social isolation by itself can be informative, it does not present a significant barrier to care access in all cases. A patient who is socially isolated but has financial means would likely be able to overcome many of the associated barriers to care. Conversely, a socially isolated patient who is also impacted by financial insecurity to the point that she has been deferring needed care has significantly more barriers to overcome to complete a wellness exam.
Once the significant barriers to care access for a patient population have been identified, we can create a plan to implement mitigation strategies to help patients overcome them. Patients with social isolation and financial insecurity can benefit from annual wellness exams that are provided as in-home, telehealth benefits or from the provision of a non-emergency transportation benefit.
Another example is patients who are impacted by food insecurity. They’re significantly more concerned with how they are going to feed themselves and their families for the week than with scheduling a preventive visit with their physician. Food card benefits, such as SNAP and community-based programs, can help improve patients’ access to food and limit cases where health care is deferred due to financial constraints.
Improving completion of annual care visits is just one example of how SDOH can be applied to improve health outcomes. Barriers to care exist in many other areas, such as prescription drugs. In many cases prescription drugs can represent a significant portion of patients’ medical expenses. This is especially true for patients on a health plan where they may be responsible for the full cost of the drug until they meet their deductible.
Patients with financial insecurity are more likely to leave prescriptions unfilled, especially those for high-cost drugs. Poor medication adherence can lead to poor health outcomes and higher costs. Health plans help their patients overcome financial barriers to medication adherence by encouraging physicians to prescribe lower-cost alternative medications when appropriate.
Understanding the Customer’s Behavioral Traits
Health plans are constantly trying to gain an edge in understanding the populations they cover. Most metrics that plans consider are at the patient level, such as risk score, comorbidities and/or disease profiles. What happens if we stop considering our members as patients and also consider them as customers?
Is there a way to shift the narrative to view them as consumers or customers, similar to how other industries do, and not simply as members or patients? In the United States, this thought process could be considered a faux pas on a surface level. But when we dive deeper, we can begin to understand the habits of our members better. Thus, we can begin to develop improved products that both serve members more effectively and work better for insurance carriers and hospital systems.
Marketing agencies use the word persona in their everyday language. Is the health care industry being stubborn by not thinking this way? If we start shifting the paradigm in the way we think about patients, we can start answering some of the more difficult questions we face in our health care system. For example:
- What if we could determine why certain members leave our health plan and others don’t?
- What if the products we offer today are not viable options for certain populations?
- What varying levels of education, financial security, comorbidities and other factors play a role in the type of health care people seek out?
If you could consider a persistency report and see that 20 percent of your members lapse, wouldn’t it be more useful to know which members are lapsing and why? What if the average risk score of the members lapsing is below the average risk score of your population? The health plan obviously wants to identify why its best risk is leaving in this scenario. One way to address these questions is to develop personas about your population.
As actuaries, we can leverage the persona framework used by marketing, while also relying on proven data analytics techniques. One method that is becoming more popular is a technique called “K-Means Clustering,” which we will call clustering in this article. Clustering is an unsupervised predictive analytics technique in which data points are grouped together into K groups. Each data point is grouped by having the closest average distance to the centroid of the closest group. In layman’s terms, each member is grouped together based on a preset number of groups in which their data points are closest to other “like” members. Table 1 is an example of the resulting grouping for six clusters based on preset categories. The shading indicates outcome severity, with yellow representing the lowest and dark green the highest.
Table 1
Member Retention Cluster Analysis
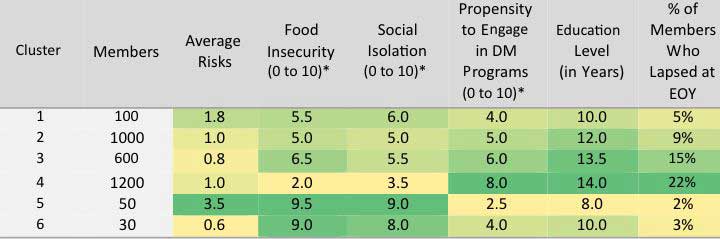
* Normalized scale where 10 is highest/most severe.
DM = disease management; EOY = end-of-year.
In this example, we can see that the members who lapse the most have the highest propensity to engage with the health plan in DM programs, while also being the lowest risk. Is the health plan doing something that is turning away these members? Where are these members going?
After reviewing some of the characteristics by combining SDOH data with standard patient metrics, we can see here that the patients remaining with the plan prefer to be socially isolated and not engage with the plan, whereas members leaving prefer more engagement. Is it possible that the habits of the insurer’s outreach programs are not sufficient for the way care is moving today?
Potentially, this plan may be behind in telehealth programs that a vast majority of the population desires. Further analysis is required, but this method opens our thinking to objectives we may not have known how to quantify in the past.
Although this example is entirely based on a “dummy” dataset, these are some of the questions we can begin to ask ourselves as we flip the framework on how we view patients. Carving out members by specific needs from the health plan may help the plan develop products that reach the best interests of everyone they serve, instead of a select group. Our hope is that as we assess our customers’ habits, health care can begin to work for everyone within the plan.
Summary
New use cases come up nearly every day where understanding the member more holistically enables actionable insights that have measurable impact on claims expense, administrative expense and/or revenue. Our stakeholders rely on us to help them leverage this data responsibly and quantify both historic impact and project future impact across a wide range of applications.
Jim Dolstad ASA, MAAA, FCA is vice president of Actuarial Consulting at Optum. He can be reached at james.dolstad@optum.com.
Justin Hartmann, ASA, MAAA is a senior consultant at Optum. He can be reached at justin.hartmann@optum.com.
Craig Cartossa ASA, MAAA, is a senior consultant at Optum. He can be reached at craig.cartossa@optum.com.