
Incorporating Random Effects to Reduce Variance in Risk Score Estimation
By Jason Reed
Health Watch, July 2021

Individual level health risk scores have myriad applications across commercial, Medicare and Medicaid managed care lines of business, including risk-adjusted payments, cost projection, measuring savings and assessing quality of care for members. Health risk scores are generally a function of demographic and condition category or other diagnosis code–based variables. Usually models do not explicitly account for the impact of the provider’s approach to resource utilization, so member risk for a given condition such as knee pain is the same regardless of whether the attributed provider practices aggressively (often recommending surgery) or conservatively (first referring to physical therapy). The result is that variation in practice pattern between providers remains an unmeasured part of the risk score model error.
We can define the impact of provider practice as the measurable change in resource utilization (be it prospective cost, 30-day readmit rate, avoidable admissions, etc.) after controlling for the distribution of conditions of the patients attributed to that provider. We propose a new risk score model framework that explicitly models the impact of provider on risk as a random effect in a statistical linear mixed model, recognizing that there are applications where this would not be desirable (i.e., quality measurement or risk stratification for member outreach programs).
One critical application is to evaluate provider efficiency more accurately. If risk scores are used to measure patient outcomes with only member-based morbidity and then used to normalize the risk of a physician’s panel, providers A and B—with very different patient risk profiles but similar average scores—would have the same performance measurement, even though their patients’ care needs may be quite different (Table 1).
Table 1
Average Risk Scores for Two Providers With Different Patient Populations

If instead we explicitly model the provider impact based on the actual attributed patient disease profile, we can more accurately recognize and fairly account for differences between Providers A and B. Such a model would yield estimates of the provider impact as an integral part of the risk score (Table 2).
Table 2
Provider Impact Based on Actual Attributed Patient Disease Profiles
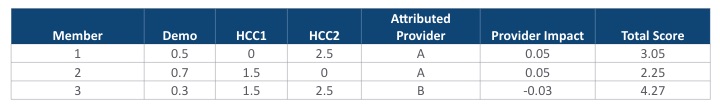
A mixed effects model would account for the actual distribution of conditions that each provider’s attributed patients have in the preceding example, yielding an estimated impact of 0.05 for Provider A (5 percent greater than average, given the condition profile of attributed patients) and –0.03 for Provider B (3 percent less than average, even considering the higher risk attributed member). This more precise measure of efficiency, represented in the model by the estimated coefficient of the provider effect, could be used to share surplus among providers more equitably. Including the provider as a random effect in our risk score model allows us to quantify that source of risk variance to better measure provider performance for incentive programs or accountable care organization (ACO) payment reconciliations.
Many health risk scoring models treat medical condition categories as indicator (0/1) variables, where some form of least squares estimation is used to construct coefficients representing the relative impact of each illness on the dependent variable Y (which may be probability of 30-day readmit, prospective cost, etc.) The model appears like this:
Y = β0 * demo + β1 * condition1 + β2 * condition2 + ⋯ + βN * conditionN + ε
It is also represented in matrix notation as Y = Xβ + ε.
In statistical parlance, we treat the demographic and condition predictor variables as fixed effects, which means they impact the average prediction but do not affect the variability around that average. In regression modeling, we consider predictors to be fixed effects when we:
- Care about the specific values that they take on (presence/absence of disease);
- Think the predictor significantly influences the dependent variable being considered (for example, future medical cost risk); or
- Would like to measure the impact in an experimental design (for example, what is the reduction in diabetes costs attributable to a given clinical program?).
There will always be many other factors, like family history, that affect health risk but are not explicitly included in a risk score model. If not modeled (part of Xβ), the aggregate impact of these unspecified factors remains in the model’s error term ε, thus inflating the variance of risk estimates and complicating the effort to determine what factors are significant.
We think of each provider’s impact as deviating from the average in some unknown and random way, with the universe of providers distributed normally about an overall impact of zero (average resource utilization given patient morbidity). We could then calculate the degree to which a provider deviated from the average, given the patients served (with credibility of estimates affected by the number of patients the provider served). The magnitude of the provider coefficient in a mixed model would tell us the impact after correcting for morbidity profile of the attributed members. With these tools, we could consider and quantify the impact of other unspecified effects as well, such as area or product selection.
Mixed effects models allow for richer statistical inference when we have correlated observations or hierarchical variables. The provider random effect allows our model to explicitly recognize that member outcomes are not independent but rather positively correlated, reflecting the attributed provider’s approach to practicing medicine. These models have the flexibility to incorporate the correlation between patients being treated by the same physician, which if not recognized would violate the statistical assumptions that validate inference in risk score models. We can think of that dependence as a hierarchy, in which the impact of member morbidity is considered only after we know the provider treating them. The provider impact is then called a variance component, where we are partitioning the total member-level variance into a piece due to provider and a piece due to random variation (including individual traits that lead to variability even for people with the same demographic and condition profile).
In statistical notation, we model each provider’s relative efficiency as a random observation from a normal probability distribution:
Provider ~ N(0,σ2)
This means that our risk score model now looks like this:
Y = β0 * demo + β1 * condition1 + ⋯ + βN * conditionN + u * Provider + ε2
where u * Provider + ε2 = ε in the original risk score equation. We have decomposed the total variance into two pieces, and the remaining unexplained variance contained in ε2 will be less than ε. This process could be iterated to encompass multiple random effects (e.g., zip code, average income, social determinants of health), which would allow for more precise estimation of the variability in Y that these effects explain and allow us to measure each factor’s impact on risk more accurately. Relative to today’s practice of normalizing by the average risk score of members attributed to each provider, leveraging these mixed effects models yields more precise measures.
The linear mixed model is often represented as
Y = Xβ + Zu + ε
where Z encodes which block each member belongs to (i.e., which provider they are attributed to) and u represents the (random) effect on Y due to that provider. Unlike β, which is a set of constants representing the fixed impact of each condition, the vector u is a set of random variables modeling a component of the total variance. The covariances between members using the same provider can then be modeled in many possible ways (for example, members attributed to the same provider can have a constant variance, while between providers could be correlated only if they graduated from the same medical school and/or practice in the same county).
The inclusion of random effects in statistical regression models allows for the flexible modeling of the impact of drivers that are correlated across members or whose impact can be better modeled as a random deviation from zero across the population of possible impacts. Adding random effects to risk score models can help actuaries precisely decompose member-level risk variance and better understand group-level variance. In the context of provider measurement, a mixed effects model would allow us to more accurately and fairly measure performance relative to the true distribution of risk assumed by each provider group.
Statements of fact and opinions expressed herein are those of the individual authors and are not necessarily those of the Society of Actuaries, the editors, or the respective authors’ employers.
Jason Reed, FSA, MS, MAAA, is a senior director of advanced analytics at Optum. He is a Fellow of the Society of Actuaries with master’s degrees in statistics and applied mathematics from Texas A&M University. He has 15 years of experience applying predictive models to complex problems in health insurance. Jason can be reached at r.jason.reed@optum.com.