
A Look at Top Health Care Systems Around the World
By Traci L. Hughes, Eric T. Viney, and Gail S. Stone
Health Watch, May 2021

Initiative 18|11 is intended to shift our focus toward health care efficiency. While the United States spends 18 percent of its gross domestic product (GDP) on health care, comparable countries spend only 11 percent of their GDP. When measured against similar countries, the United States has one of the highest disease burdens, one of the highest rates of medical error, and one of the lowest quality and access index ratings.[1] No country’s health care system is perfect, but these measures beg the question, what can the United States learn from other countries’ health care systems? How are other countries more efficient? Increased efficiency generally can be broken into two components: increased quality and decreased costs. We selected five countries that have been among those debated as having some of the most efficient health care systems to explore what the United States can learn from these examples. Appendix A shows a historical comparison of health care expenditures as a percentage of GDP for these five countries and the United States.
United Kingdom
All residents of the United Kingdom are entitled to free public health care through the National Health Service (NHS), including hospital, physician and mental health care. The NHS budget is funded primarily through general taxation, and NHS represents the largest single-payer and socialized health care system in the world. The United Kingdom’s health care expenditures are 10 percent of its GDP.[2] Public funding accounts for 80 percent of total health expenditures, private health insurance accounts for 3 percent, enterprise financing accounts for 1 percent, and household out-of-pocket costs account for 16 percent.[3]
Strategies for Increased Quality[4]
The NHS has very limited cost-sharing for publicly covered services. Patients can choose their primary care physician or general practitioner (GP), who can refer them on to specialists and hospital care if needed, which also helps to contain costs. Services are free at the point of use for outpatient and inpatient hospital services and most physician visits.
The quality of care provided by the NHS is measured primarily by the Care Quality Commission (CQC) and the National Institute for Health and Care Excellence (NICE). The CQC regulates all health and social care in England. All providers must be registered with the commission, which monitors performance using nationally set quality standards and investigates individual providers who do not adhere to these guidelines. The CQC also rates hospital inspection results and can close down facilities with poor performance. NICE provides quality and effectiveness guidelines for a range of clinical conditions, recommendations for wait times for various treatments, and analysis of the cost-effectiveness of pharmaceuticals and other health technologies.
Strategies for Decreased Costs
Costs in the NHS are constrained by a national health care budget that cannot be exceeded, rather than by patient cost-sharing or constraints on supply. Clinical Commissioning Groups (CCGs) are allocated funds by the NHS, and both CCG and NHS providers are expected to achieve a balanced budget each year. From 2010 through 2015, average real-term growth in spending on health care rose by 1.2 percent, much lower than the historical growth rates. However, this mismatch in funding, demand and the cost of providing services has led to some providers accumulating underlying deficits.
Strategies to contain costs include staff pay increase freezes, promoting higher generic drug dispense rates, reducing Diagnosis-Related Group (DRG) payments for hospital stays and reducing administrative costs. Costs for brand-name prescription drugs are contained through a voluntary agreement between the UK government and the pharmaceutical industry. This currently limits the sales growth of brand-name drugs to 2 percent per year.
Sweden
Sweden’s health care expenditures are 11 percent of its GDP.[5] Base coverage is universal, funded by the government through taxes and supplemented by private health insurance. Public funding accounts for 85 percent of total health expenditures, private health insurance accounts for 1 percent, and household out-of-pocket spend accounts for 14 percent.[6]
Strategies for Increased Quality
Primary care providers are required to provide after-hours care, and practices in proximity to each other collaborate on after-hours arrangements. This provides individuals with an option to access nonemergency care outside of typical business hours. Payment and reimbursement arrangements are the same as those applicable during regular hours.
Additionally, since 2006, the National Board of Health and Welfare has published annual performance comparisons and rankings of each county council’s health care services, using data from various national quality registers. Statistics on patient experiences are made available online to help guide individuals in their choice of provider.
Strategies for Decreased Costs
Provider fees are all set by county councils where 60 percent of primary care providers and almost 100 percent of hospitals are publicly owned, giving the councils a great ability to implement a variety of cost-control measures. The government also sets value-based pricing for prescription drugs where reimbursement is based on an assessment of health needs and cost-effectiveness.
In addition, municipalities can reimburse informal caregivers for long-term care services either directly (“relative-care benefits”) or by employing the caregivers (“relative-care employment”). This creates a lower-cost alternative to long-term care in the facility setting, such as a private-duty nurse, nursing home or hospice.
Germany
Germany has one of the world’s oldest universal health care systems[7] dating back to the Health Insurance Act of 1883, which created the world’s first statutory health insurance scheme.[8] Germany’s health care expenditures are 11 percent of its GDP.[9] The statutory health insurance (SHI) administration is handled by more than 100 nongovernmental insurers known as “sickness funds.” These funds are financed primarily through general wage contributions (approximately 15 percent of wages up to a certain income threshold) shared equally by employers and employees. A risk-adjusted capitation formula is used to reallocate these contributions to the individual sickness funds. Just under 30 percent of Germans also purchase supplementary private insurance to cover additional amenities and benefits not covered by SHI. Public funding accounts for 78 percent of total health expenditures, while private health insurance accounts for 9 percent, and household out-of-pocket spend accounts for 13 percent.[10]
Strategies for Increased Quality
The German health care system provides patients with an almost unlimited choice of sickness funds (insurance companies), hospitals, and physicians, with minimal co-pays. Patients have no gatekeepers and have access to any physician in the country. Germany has approximately 8.2 hospital beds per 1,000 population, a ratio about 2.5 times that of the United States and which is exceeded only by Japan. Physicians and hospitals are geographically convenient; average Germans have a primary care physician within 15 minutes of where they live.
The most important body overseeing health care in Germany is the Federal Joint Committee, which has broadly defined a range of measures for the quality of care. The Institute for Quality Assurance and Transparency (IQTiG) is responsible for measuring and reporting on quality of care and provider performance on behalf of the Federal Joint Committee. The institute develops criteria for evaluating certificates and quality targets, and all hospitals are required to publish findings on indicators defined by the IQTiG. Quality reporting data are published for 1,600 hospitals across 290 process and outcome indicators across 30 treatment areas; these data help patients choose where they want to receive care. Additionally, the Institute for Quality and Efficiency in Health Care (IQWiG) is legally charged with evaluating the cost-effectiveness of drugs with added therapeutic benefits.
Strategies for Decreased Costs
Health insurance is mandatory in Germany, and approximately 88 percent of the population is enrolled in statutory health insurance. Another 11 percent (government officials, the self-employed, and some people earning over the “opt-out” income threshold) choose private health insurance instead. To prevent antiselection, opting in to the private system is a onetime, lifetime, and nearly irrevocable decision.
Germany has a rigorous process for determining the price of a new drug within the first 12 months of it being brought to market. A drug can sell at any price in those initial 12 months. If the IQWiG determines that the drug does not provide any additional clinical benefits, the maximum price (internal reference price) is derived from the price of other comparable drugs on the German market. If the drug is determined to have additional clinical benefits compared with existing drugs, the price premium is set (by the Federal Joint Committee) to reflect the added therapeutic value of the drug.
Canada
Canadian Medicare is a universal, publicly funded health care system. Canada’s health care expenditures are 11 percent of its GDP.[11] Provinces and territories in Canada have primary responsibility for organizing and delivering health services and supervising providers. Many have established regional health authorities that plan and deliver publicly funded services locally. Public funding accounts for 69 percent of total health care costs, out-of-pocket accounts for 15 percent, private insurance accounts for 12 percent, and 3 percent falls under the category of “other.”
Strategies for Increased Quality
After-hours care is often provided by physician-led (and mainly privately owned) walk-in clinics. Traditionally, primary care physicians are not required to provide after-hours care, although many of the government-enabled group practice arrangements have requirements or financial incentives for providing after-hours care to registered patients. In most provinces and regions, a free telephone service (“telehealth”) is available 24 hours a day for health advice from a registered nurse. This provides convenience for Canadians to access health care but may also save costs on services that are lower-cost alternatives to emergency or urgent care.
Many provinces have agencies responsible for producing health care system reports and for monitoring system performance, and many quality improvement initiatives take place at the provincial and territorial levels. The federally funded Canadian Patient Safety Institute promotes best practices and develops strategies, standards and tools. Provinces and territories have introduced several initiatives to improve integration and coordination of care for chronically ill patients with complex needs.
Strategies for Decreased Costs
Primary care physicians act largely as gatekeepers, with lower reimbursement paid to specialists for nonreferred consultations. This lowers costs via care coordination.
Other cost-control measures include mandatory global budgets for hospitals and regional health authorities, negotiated fee schedules for providers, drug formularies, and resource restrictions vis-à-vis physicians and nurses (e.g., provincial quotas for students admitted annually), as well as restrictions on new investment in capital and technology.
Japan
Japan’s health care expenditures are 11 percent of its GDP.[12] The health care system in Japan provides health care services with the patient accepting responsibility for 30 percent of the costs, while the government pays the remaining 70 percent. Payment for medical services is offered by a universal health care insurance system with fees set by a government committee. All residents of Japan are required by law to have health insurance coverage.
Strategies for Increased Quality
By law, prefectures are responsible for making health care delivery “visions,” which include detailed plans on cancer, stroke, acute myocardial infarction, diabetes mellitus, psychiatric diseases, pediatrics and home care as well as emergency, prenatal, rural and disaster medicine. These plans include structural, process and outcome indicators, as well as strategies for effective and high-quality delivery. Prefectures promote collaboration between providers, sometimes offering financial incentives.
For quality reporting initiatives, Japan’s Ministry of Health, Labour and Welfare organizes and financially promotes voluntary benchmarking in which hospitals report quality indicators on their websites. Additionally, surveys of inpatient and outpatient experiences are conducted and publicly reported every three years.
Strategies for Decreased Costs
Price regulation for all services under Japan’s statutory health insurance system (SHIS) is a critical cost-containment mechanism. The fee schedule is revised every other year by the government, following formal and informal stakeholder negotiations. The revision involves three levels of decision making: the overall rate of increase or decrease of benefit prices, drug and device prices, and prices of services on an item-by-item basis. For medical, dental and pharmacy services, the Central Social Insurance Medical Council revises fees on an item-by-item basis to meet overall spending targets set by the cabinet. Highly profitable categories usually see larger reductions.
United States
In contrast to all the countries discussed, the United States does not have universal health coverage, with 9 percent of the population uninsured. The United States offers a mix of public and private insurance, with publicly funded coverage for adults 65 and older, individuals with disabilities, and low-income populations. Public funding accounts for 45 percent of health care spending, private funding for 27 percent and household out-of-pocket costs for 28 percent.[13] U.S. health care expenditures are 18 percent of its GDP.[14]
Strategies for Increased Quality
The United States has several initiatives for monitoring quality of care, including the ACA-established National Quality Strategy; the Agency for Healthcare Research and Quality (AHRQ); the Centers for Medicare and Medicaid (CMS) Hospital, Physician and Nursing Home Compare; and the Healthcare Effectiveness Data and Information Set (HEDIS). The CMS Hospital, Physician and Nursing Home Compare is a public resource summarizing the performance of more than 4,000 hospitals on measures of care processes, care outcomes and patient experiences.
Strategies for Decreased Costs
When it comes to public health care in the United States, some cost control initiatives have included setting provider rates for Medicare and setting capitated payments with Medicaid managed care organizations. Private insurers have also introduced cost control initiatives such as tiered provider pricing and benefits and volume-based pharmacy rebate programs. However, annual per capita U.S. health expenditures remain the highest in the world.
Possible U.S. Strategies for the Future
Price Transparency
To date, at least nine states maintain consumer price comparison tools: Colorado, Connecticut, Florida, Maine, Maryland, Massachusetts, New Hampshire, New York and Washington.[15] In October 2020, the United States issued a final rule on price transparency.[16] The rule will require health plans to offer an online shopping tool that allows consumers to see the negotiated rate between their provider and their plan, as well as a personalized estimate of their out-of-pocket costs for 500 of the most shoppable items and services starting in 2023. Further, in 2024 these shopping tools will be required to show the costs for the remaining procedures, drugs, durable medical equipment and any other item or service consumers may need. The results of this approach will certainly be monitored very closely in the United States.
Drug Cost Containment
Over the last several years, the majority of states have taken various approaches to achieving drug cost containment. These include drug price transparency, drug price board review processes, price increase thresholds, drug importation, requiring brand name manufacturers to sell licensing to a generic drug manufacturer seeking to develop a generic alternative, and more.[17]
In July 2020, the United States finalized regulation that expressly excludes rebates on prescription drugs paid by manufacturers to pharmacy benefit managers (PBMs) and Part D plans from safe harbor protection under the Anti-Kickback Statute.[18] The rule also creates a new safe harbor protecting discounts reflected in the price of the drug at the pharmacy counter. Finally, the rule creates new safe harbor protection for fixed-fee service arrangements between manufacturers and PBMs. This rule, which becomes effective in 2022, provides a good opportunity for the United States to contain drug costs at the national level.
Provider Budgeting
Maryland, Massachusetts and Vermont are all states with provider budgeting initiatives. In 2014, Maryland implemented a global hospital budgeting program in which all payers (Medicare, Medicaid and private insurers) in aggregate pay hospitals a fixed annual amount for services—an amount set by the Health Services Cost Review Commission. In 2006, Massachusetts established a Health Care Policy Commission (HCPC) that is responsible for regulating costs and setting annual limits on health care cost growth among all providers and payers. The HCPC has the authority to impose heavy fines on entities for not complying with these health care growth plans. In 2011, Vermont created the Green Mountain Care Board, which governs a hospital budget review process to negotiate global hospital budgets for the state.[19]
All three of these states have observed recent annual health care expenditure growth rates of 1.5 percent (Maryland),[20] 1.6 percent (Massachusetts),[21] and 1.7 percent (Vermont)[22] compared to recent nationwide growth rates of 4.6 percent.[23] If implemented on a wider scale, this policy could potentially help reduce annual health care expenditure growth.
Universal Coverage
Vermont, Colorado, and Massachusetts have all come close to implementing a form of universal coverage for their states but have not ultimately passed it through. One of the biggest barriers is high overall cost and concern regarding the cost and tax impact to households and small businesses.
Where to Go Next
There is no doubt that health care is one of the biggest issues facing the United States as a country. What should we try next? Universal coverage? More affordable after-hours care? More consumer engagement in provider quality? Or consumer engagement in provider costs, maybe even a universal price transparency tool? Provider and pharmacy fees that are set by the government across the board? Would any of these choices even work in the United States as they do in other countries? Everyone has their own opinion about the “right” answer, and whether it’s one move or multiple steps that “should” be made. One thing is for certain: looking at other countries that have achieved lower levels of health care expenditure than the United States can provide a vision of what it could look like to have a more efficient and cost-effective health care system.
Statements of fact and opinions expressed herein are those of the individual author and are not necessarily those of the Society of Actuaries, the editors, or the respective author’s employer.
Traci L. Hughes, ASA, MAAA, is a Consulting Actuary at Lewis & Ellis, Inc. She can be reached at thughes@lewisellis.com.
Eric T. Viney, ASA, MAAA, FCA, is a Specialist Leader at Deloitte. He can be reached at eviney@deloitte.com.
Gail S. Stone, FSA, MAAA, is Manager for Actuarial Services at Centene. She can be reached at gail.stone@centene.com.
Appendix A
Current Health Expenditure as a Percentage of Gross Domestic Product: 2017 with 5-, 10- and 15-Year History
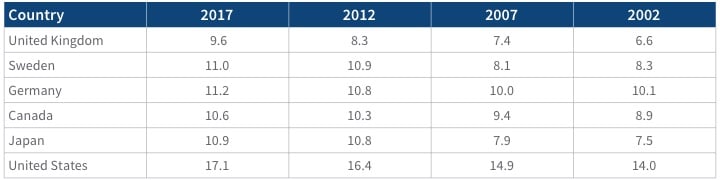
Source: Global Health Observatory Data Repository. Current health expenditure (CHE) as percentage of gross domestic product (GDP) (%): Data by country. World Health Organization, Jan. 7, 2020, https://apps.who.int/gho/data/node.main.GHEDCHEGDPSHA2011?lang=en.