By Stuart Rose
 Analytics is a hot topic, and everyone is talking about it. But analytics is not new to the insurance industry. In fact, it could be argued that the first mortality tables were a form of analytics since the actuaries were using historical data to forecast the survival rates of their policyholders and insureds. But, compared to many other industries, insurance companies are seen as laggards when it comes to analytics. Why is this?
One reason is that until now, analytics has predominately been seen as a back-office function, used by silo departments, such as claims, actuarial and marketing. To become analytically efficient, insurance companies need to create a strategic culture where data and analytics are part of the corporate DNA.
The digital age has brought with it a quantum increase in the amount of data available, but it is not just the quantity of data that sets this time in history apart. The speed with which data reaches organizations, the variety of their form and the insights they contain are completely changing everything we have known about the collection, analysis and management of data.
But the real challenge begins when companies begin extracting meaningful insights from this explosion of data. Determining how to take advantage of all this data to price better, expand markets, and improve the business of underwriting risk and handing claims are all daunting tasks. Fortunately, the science of extracting insight from data is constantly evolving. Below are several analytical techniques that can help insurers get value from data.
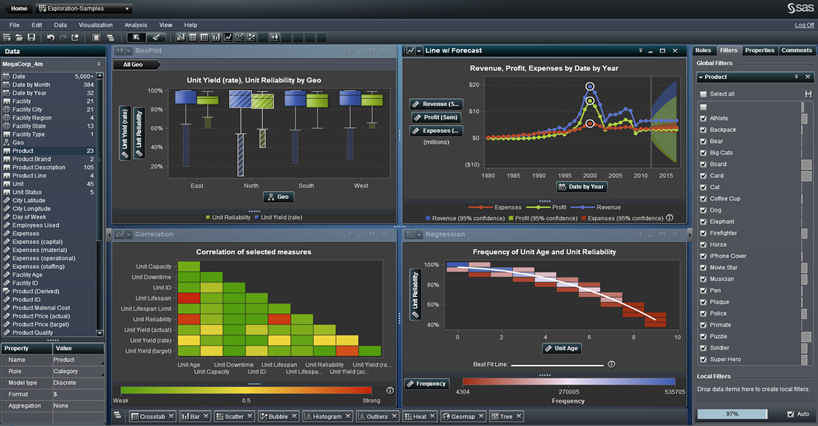
Data Visualization
Data visualization, where information is presented in a pictorial or graphical format, is helping insurance professionals see things that were not obvious to them before. Insurance companies analyze historical data—which includes information from policy administration solutions, underwriting applications and billing systems—to forecast and predict future losses.
A picture is worth a thousand words—especially when you are trying to understand and gain insights from data. It is particularly relevant when you are trying to find relationships among thousands or even millions of variables and determine their relative importance.
Data visualization is an art and a science unto itself and there are many graphical techniques that can be used to help insurance executives better understand the story their data are telling. However, one of the biggest challenges for non-technical and business users is deciding which visual should be used to represent the data accurately. Auto-charting determines the most appropriate visualization by understanding the data and its composition, what information insurers are trying to convey visually and how viewers process visual information.
Imagine if power insurers could harness the insights hidden within that vast sea of structured and unstructured data.
Predictive Modeling
Predictive modeling or data mining goes beyond reporting on what has happened to discovering why it has happened and what is likely to happen next. Data mining consists of multiple different modeling techniques such as decision trees, neural networks, clustering combined with advanced regression and statistical routines to deliver more accurate models. Typically, predictive modeling is performed offline as a back office function by actuaries and other statisticians. More than ever, insurance companies need to integrate analytics into their transactional systems to improve operational efficiency.

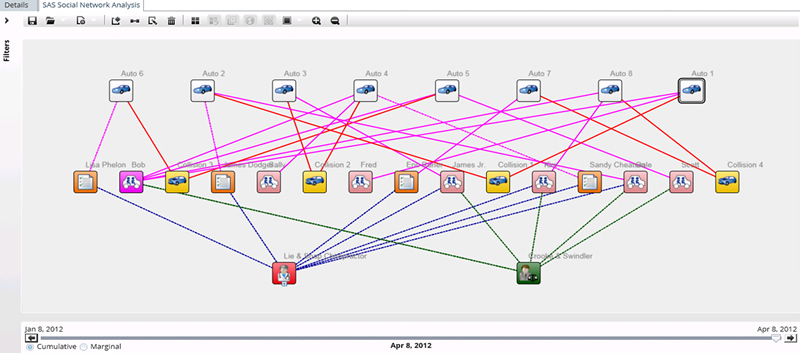
Link Analysis
From a technology aspect link analysis converts data into a set of interconnected linked objects that can be visualized as a network of effects. From a business perspective, link analysis enables marketers to analyze social networks and identify relationships among customers, and then use that information for more accurate profiling and segmentation. The explosive growth of social media has greatly strengthened the power that the opinions of friends and family have on a customer’s buying decisions. A link analysis visualization tool enables insurers to see a complete picture of individual customers, their products, transactions and networks at the click of a button.
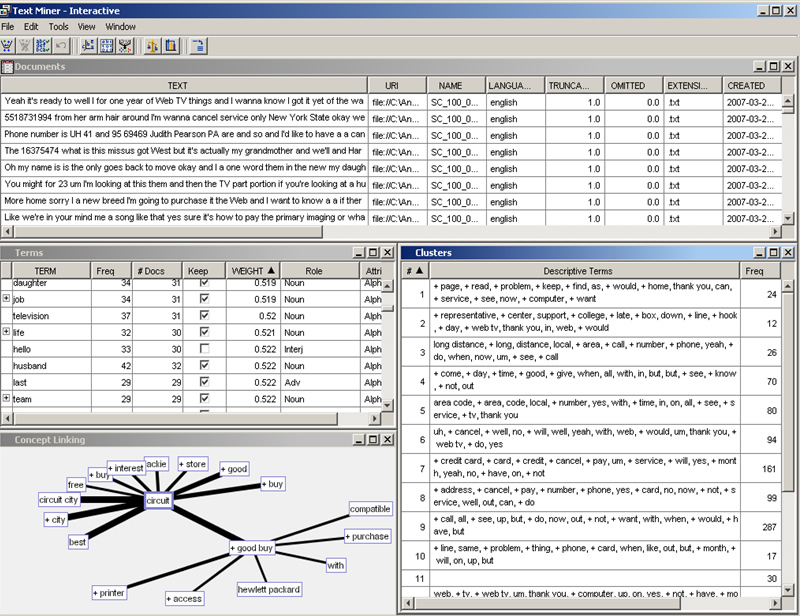
Text Analytics
Imagine the power if insurers could harness the insights hidden within that vast sea of words. Medical records, emails, underwriter notes, call center logs, video, even Twitter and blogs are all examples of unstructured data. By most estimates, at least 80 percent of the information available in an organization is actually unstructured data and that percentage is likely to increase with the growth of social media. But for insurance companies, it might just as well be called invisible data. For an industry that is driven by data, text analytics is still new to most insurance companies.
Text analytics is the use of computer software to annotate and extract information from electronic text sources and analyze that information for business purposes. Text analytics includes; sentiment analysis which automatically locates and extracts sentiment from online materials and text mining which provides powerful ways to explore unstructured data to discover previously unknown concepts and patterns.
Closing Point
Every organization is continuously looking for that “X factor,” something that will differentiate them from their competitors. For insurance companies that X factor is often hidden in mountains of data.
Insurers have long seen data as a source of competitive advantage. But data alone is worthless—it is insights derived from the data that matter and with the emergence of big data the possibility for deriving insights is increasing dramatically.
Comprehensive analytics management capabilities, from data to decision, make it possible for organizations to take advantage of sophisticated analytical techniques, a large number of analytical models, and a virtually unlimited number of variables and data volumes.
Insurance companies taking advantage of big data and analytics will uncover the X factor much faster than their competitors.
Stuart Rose is Global Insurance Marketing Director at SAS. He can be reached at Stuart.Rose@sas.com or follow him on Twitter @stuartdrose.