 By Tim Heng
This is the first article in a series relating to Microsoft’s Power BI suite of programs (not to be mistaken for Power BI, the software, but definitely related).
Setting the Scene—Power Pivot
Yesterday was an interesting day for Richard’s retail empire. From his dashboards, he could see that sales were up (a good thing), but the product mix was skewing away from his higher margin products (a bad thing), and were entirely purchased using discount codes and other similar “special” prices,
which drove margins down further (a very bad thing). Richard could also see that profitability across certain key stores was particularly strong, but that they were subsidizing other retail platforms that were unprofitable and had no strategic purpose, other than cannibalizing sales from profitable stores.
Tomorrow will be an interesting day for Richard’s empire as well, as he takes the insights from his Power Pivot-driven dashboards and restructures his business accordingly.
These sorts of insights and analyses have historically been the domain of bespoke accounting software packages and customized internal systems. Whether you have previously used cubes, SQL databases, SAP dashboards, or any combination of the above, it typically requires a large investment setting up
appropriate reporting tools, and paying a consultant or an expensive IT team to help you maintain and make updates to the system.
Wouldn’t it be great if you could do all of that in Excel? A conventional PivotTable has the ability to generate some insights, but is typically restricted to just a single table or source of data, meaning that companies would still need some database tool such as Access or SQL to get the right data before you could analyze
it. Often, manual tools are employed to take and transform data across spreadsheets and consolidate these into a single table to be pivoted.
Enter Power Pivot. Power Pivot is a “new” tool in Excel that was introduced into certain shelf versions of Excel from 2013 onwards, and has been a downloadable add-on for Excel 2010 for some time before that. Power Pivot essentially removes the need to have risky links between spreadsheets, reduces
the time required in establishing relationships, and allows you to get the answers that you’re looking for faster than ever before. It’s basically Access or SQL, but for the masses of people who are familiar with Excel.

Import your data into Power Pivot
Data can be brought in using a variety of methods and from a wide range of sources. You can refer to tables within the existing spreadsheet that you want to create your PivotTables on, or you can establish data connection links to other files. One important feature of Power Pivot is
that the data connection is read-only and cannot be modified—unlike links which can (or inevitably will!) be overridden or hardcoded, the data that comes across will always be intact and unchanged.
Other data sources include text and CSV files, SQL servers and Access Databases, data services such as Microsoft Azure or OData, systems such as Oracle and Teradata, or any other data feed that could normally be imported into Excel.
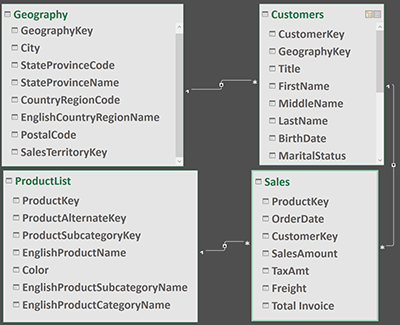
Once the data is in Power Pivot, it’s an Access-like interface that allows you to drag and drop relationships between tables. Notable is the restriction that at the time of writing, Power Pivot in Excel only allows you to establish one-to-many relationships between tables. However, Power Pivot within Power BI has
the ability to create more complex joins, so we can assume that Microsoft is going to roll that out to Excel sooner rather than later.

You will also note that when the data is stored in the Data Model (i.e., the fancy term for the Power Pivot back engine room), it stores data much more efficiently than within an Excel sheet or even a CSV or text file. The compression ratio will depend on the dataset,
obviously, but we have recently taken approximately 3.5GB of files and condensed it into a data model that fits nicely into 250MB.
Create Calculated Columns and Measures
Calculated Columns refer to additional columns that you can create to assist in your analysis. Perhaps this is necessary because an item isn’t contained in the underlying dataset, or because it requires two different sources of information to determine. These get applied to every row in a
particular table that has been brought in. As such, from a performance perspective, it takes longer to import and refresh data, along with taking up more memory and file size.

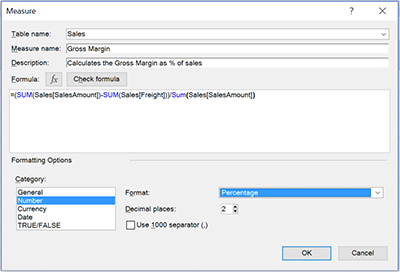
Measures (or Calculated Fields in Excel 2013) are calculations that are done within the PivotTable. As such, it uses the PivotTable calculation process to firstly filter out the items that actually need to be calculated, then perform the calculations on only the subset of the data applied. As a result, although the calculations are done in real-time (and so will be a little bit slower than pre-calculating in a column), they will not take up any additional file size, and will be reasonably fast as they calculate only on data that is being used at any point in time.

Both Calculated Columns and Measures use the DAX formula language. This is very similar to Excel’s formulae, with slightly different syntax for some functions, along with some different functions, especially in the Time Intelligence space.
Case Studies and Applications
There are instances of Power Pivot being applied around the world in a range of industries and teams. Here are a few examples:
A sporting organization is using Power Pivot to replace a budgeting spreadsheet that previously had links to more than 50 other spreadsheets that different business units produced for their individual budgets. These links would need to be manually re-entered into
different rows, as the size of budget sheets changed each reporting cycle, and any hard-coded overrides would need to be cleaned out. With Power Pivot, they created a data connection to a hidden table in each individual sheet, aggregated them into a single large table and filtered out the unused rows. They then matched
these back to a table containing the company’s chart of accounts and GL information, and used this to create PivotTables to produce reports and to set up the budgets in the correct format to upload to their core accounting systems.
A hotel chain is using Power Pivot to link hotel reservations data up against vacancy rates and competitor pricing information, each stored in different systems and tables. Once linked, PivotTables and filters are easily used to generate reports for each hotel outlining their KPIs and performance. Because
the information changes day to day, Power Pivot refreshes the data each morning directly from their SQL databases and the web, with just the click of a button instead of manual and tedious updates to Excel formulae.
A bank has processes in place using SQL to drive reporting and analysis on a daily and monthly reporting level. However, these processes mean that any new questions that get asked often take days to be answered, as SQL code needs to be written, by an overworked IT team without
a core understanding of how the business runs at a commercial operations level. By using Power Pivot, the IT team can comfortably give access rights to the business knowing that the integrity of the data will be preserved, and the business can generate their insights using the flexibility of Excel, rather
than needing to learn more technical IT skills.
How to get Power Pivot
If you have Excel 2010, then you can download it for free. Note that there are some known compatibility issues between Excel 2010 and Excel 2013, so in order to future-proof your work, you may want to use Excel 2013 or Excel 2016 instead.
If you have Excel 2013 or 2016, then you need to get one of the specific versions of Office that has Power Pivot included. These are the Microsoft Office 2013/2016 Professional Plus (for the one-off purchase versions) or Office 365 ProPlus (for the subscription service). Once you have either of
these versions installed, go to your COM add-ins and enable Power Pivot there.
Words for the Wise
A few final thoughts on using Power Pivot:
- Power Pivot is a memory hog. While 32-bit versions of Excel might be able to handle a few hundred thousand records of data, 64-bit can handle a few hundred MILLION records with relative ease.
- Make sure you use a calendar table, or ensure that the table your dates are stored in is defined as a date table. This is critical to ensure that Power Pivot’s Time Intelligence functions such as YTD and MTD calculations work correctly.
- As a general rule, set up any additional calculations as Measures rather than Calculated Columns, to keep memory usage and file size down.
- If you want to transform your data at all, while you can do it in Power Pivot, there is a general consensus that the best way to do so is to import the data and transform it using Power Query, and use Power Pivot as your analysis tool by building the measures required.
What is Power Query? Glad you asked—stay tuned for part two in the next issue!
Tim Heng is a director at SumProduct, specializing in Excel modeling and training services. He can be contacted at
tim.heng@sumproduct.com.