By Dr. Mildred Hastbacka
What’s the dollar value of manufacturing flexibility to a car manufacturer? What’s the dollar value of getting the market to make your product development trade-off decisions for you? These are business-critical questions and their answers lie in part in the application of the quantitative tools.
My previous article in Innovators & Entrepreneurs reviewed some product development projects that failed to meet target business expectations in part because non-technical risk factors were not identified or quantified.1 This article will share two success stories. These examples demonstrate how successfully applying quantitative tools in product development can improve product launch success rates and, consequently, a company’s top and bottom line.
The Second Toyota Paradox2
Toyota’s competitive success is rooted in part to managing their product design and production processes in unconventional ways. One of those paradoxical processes, the second Toyota paradox, is Toyota’s decision-making regarding how and when to move from an initial long list of car design concepts to the final concept that will actually be produced—a process step called convergence.
Historically, Toyota’s approach to convergence was different from its competitors. Rather than deciding early in the product development cycle on one design and “freezing” it (a point-based approach to convergence), Toyota’s product development teams select a set of acceptable alternative designs for further assessment.
Subsequently, after additional technical vetting and testing, this set is winnowed down to the final selection. Those familiar with real options will see in this process a reflection of the real options approach: keeping multiple options “in play” and eliminating options when more data, information and analysis supports that move.
David N. Ford and Durward Sobek3 developed a model of this product development process based on real options concepts to understand how Toyota’s set-based development process could add value relative to a point-based convergence approach. According to the simulation developed and reported by Ford and Sobek, keeping final design options open until later in the development process has a calculable dollar pay-off relative to settling on one design at the beginning of the project. Figure 1 charts this value over the entire course of the development program and shows that the value of delaying a final design until halfway through the project is of the order of $100 million.
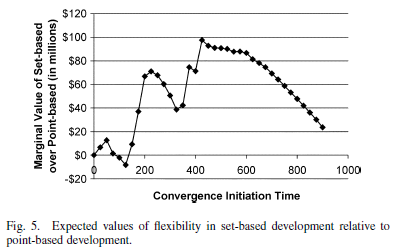
Fig. 1. Value of project flexibility in set-based development relative to point-based development; convergence initiation time is expressed in days; convergence initiation time is a time zero for point-based convergence. (Ford and Sobek)
Ford and Sobek’s work is encouraging with respect to the potential for the application of real options models tailored to product development processes to support value-driven decision-making.
Saving Money by Getting the Market to Make Trade-Offs
Conjoint analysis is a tool used by product managers to understand trade-offs the target market is expected to make with respect to a range of product features and benefits. Conjoint analysis is most often used in consumer products, but it’s also successfully applied to engineered industrial products, safety products and medical equipment—in other words, products where the basis for customer selection and purchase is thought to be nearly purely objective. Such products are much less frequently subject to the kind of direct customer/stakeholder input that could make the commercial outcome of product development more predictable.
Yet, despite the objective specifications to which such products are built, the fact is that subjectivity still influences ultimate purchase decisions. These subjective elements can make the difference between a “hit” the first time out in the market and an initial market disappointment.
A case in point is a company about to invest tens of millions of dollars in a next-generation model of graphic arts imaging equipment. Before making this investment, the company decided to engage in a global effort to elicit user input via focus groups comprised of actual users and purchasers of the equipment being studied. Group participants were led to identify, prioritize and rank the relative importance of specific product attributes to equipment selection and purchase. Competing products were also identified by the participants and regression analysis was used to develop statistical models that would reveal significant differences among products. This global focus group effort resulted in two key findings:
- The company’s existing imaging equipment trailed the leading competing model in only two of the functions considered key as purchase criteria and
- customer expectations for the then-emerging digital technology were so strong that no improvements in the trailing technology could delay its market penetration.
Looking at the implications of these two key findings, the company decided that investing tens of millions of dollars in the next-generation model using the trailing technology couldn’t be justified, either in terms of potential market share gain or in terms of delaying the advance of the new technology. Instead, with high confidence in the results of this statistically robust user preference research, the company redirected its business focus toward developing a strategy to respond to the fast-emerging digital technology.
Both companies featured in this article had the same core challenge: how to manage business growth in the face of substantial technical and market uncertainty. But substantial uncertainty doesn’t necessarily mean substantial risk nor does it mean unmanageable risk. Explicit recognition and identification of the associated project risks, together with application of the relevant quantitative analysis tools, led to high-confidence decisions regarding if and how business resources should be deployed to achieve target growth objectives.
References
- Mildred Hastbacka, “Partnering with Product Development via Predictive Modeling,” Innovators & Entrepreneurs, November, 2017, /News-and-Publications/Newsletters/innovators-and-entrepreneurs/2017/november/Partnering-with-Product-Development-via-Predictive-Modeling.aspx
- Allen Ward, Jeffrey K. Liker, John J. Cristiano, and Durward Sobek II, “The Second Toyota Paradox: How Delaying Decisions Can Make Better Cars Faster,” MIT Sloan Management Review, April 15, 1995, https://sloanreview.mit.edu/article/the-second-toyota-paradox-how-delaying-decisions-can-make-better-cars-faster/
- David N. Ford and Durward Sobek, “Adapting Real Options to New Product Development by Modeling the Second Toyota Paradox,” IEEE Transactions on Engineering Management, June 2005, p. 175 http://ieeexplore.ieee.org/abstract/document/1424408/
Mildred Hastbacka, Ph.D., is founder and managing member of Prakteka LLC, a business-focused technology consulting company. She can be contacted at http://www.prakteka.com or mah@prakteka.com.