Transforming Group Underwriting Using Artificial Intelligence and Machine Learning

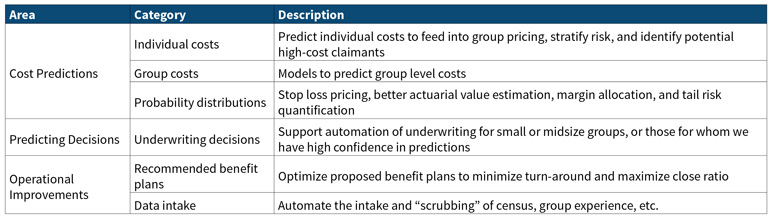
There are many opportunities for using machine learning and artificial intelligence in group health underwriting including those outlined in the table below. This article will discuss cost predictors and predicting behavior and decisions.
Predicting Costs
Use of machine learning can improve upon traditional risk adjusters used in underwriting. Using machine learning enables inclusion of novel model inputs that can then be combined in non-linear ways to improve the model fit and predictive R2. Cost predictions for underwriting can be tuned to actual costs to make better underwriting predictions.
Machine learning offers the following specific advantages:
- Some machine models do a much better job of “finding” interrelations between variables than regression models, allowing for better predictions and simpler model inputs (e.g., no need to specify comorbidities as separate variables).
- Machine learning models assimilate large quantities of data with ease, finding hidden structure in the data even when there is multicollinearity or other non-linear model structures that can interfere with traditional statistical modeling.
- Machine learning facilitates intelligently curating features (claims data, derived cost statistics, etc.) to maximize predictiveness and model the true shape of the distribution.
- Use of external data (SDoH/consumer data) can improve predictions, especially for members with minimal claims data.
However, machine learning models are not entirely independent, and need to be adjusted for the following factors:
- Costs vary by time, region, payer, and provider.
- Models trained on multi-payer data sets don’t reflect a specific payer’s payment approach; to account for this, consider transforming claims data to use a common reimbursement schedule, then adjusting to payer-specific reimbursement.
For group costs, predictors can build upon individual cost predictions while recognizing group characteristics such as industry, turn-over, and consumer data. The goal is to build models that can predict overall group costs and quantify group risk better than traditional underwriting, even for larger groups that would traditionally be considered fully credible.
When modeling group costs, consider the following:
- Will brokers and employers accept the new methodologies?
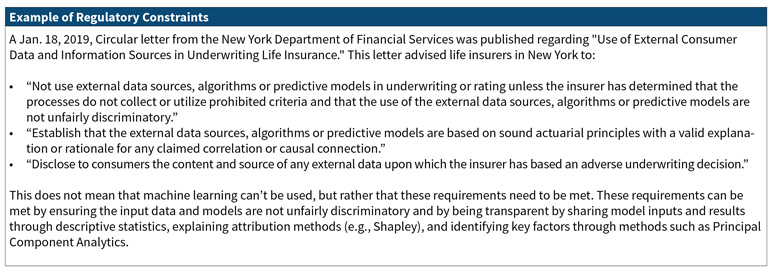
- Are there regulatory constraints? Specifically, how will the rating approach be filed to reflect the utilization of these new technologies?
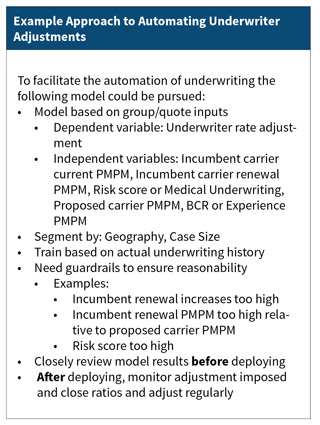
- Should the machine learning model be used in parallel to traditional underwriting? Perhaps the machine learning model can be an input to traditional experience rating or to support concession decisions only.
Beyond point estimators, individual and group probability distributions can be modeled, allowing for estimating confidence intervals, stop loss pricing, and benefit relativities. This will be presented in more detail below under Stop Loss Pricing and Large Claim Analytics.
Stop Loss Pricing and Large Claim Analytics
Stop loss pricing requires an accurate understanding of events in the tail of the distribution, which represents high risk but low probability events. Current actuarial practice either forecasts only the mean (e.g., leveraging risk scores or prior claim experience) or constructs a single claim probability distribution (e.g., for benefit relativity pricing). Thanks to the explosion in modern computing power, tools now exist to estimate the entire probability distribution of individual risk, conditional on a rich individual-level characterization of demographics and health history. (Machine learning can be leveraged to solve the non-linear minimization problem needed for an unbiased estimate of the percentiles.)
Risk scores today forecast the expected (average) future relative claims cost given a set of predictors (age, gender, conditions, Rx utilization, comorbidities, …) via equations such as 𝐸(𝑦)=1.2∗𝑎𝑔𝑒+2.9∗𝑔𝑒𝑛𝑑𝑒𝑟+5.1∗𝐸𝑅𝐺. Actuaries can do much more with percentiles of future claim distribution, which might look like this:
y25th=0.6*age+1.2*gender+0.4*ERG
y50th=1.6*age+3.2*gender+4.8*ERG
y98th=0.3*age+0.5*gender+6.7*ERG
Such modeling techniques allow us to build confidence intervals, understand when experience is extreme, model stop loss, and distinguish true changes in risk profiles from random statistical variations.
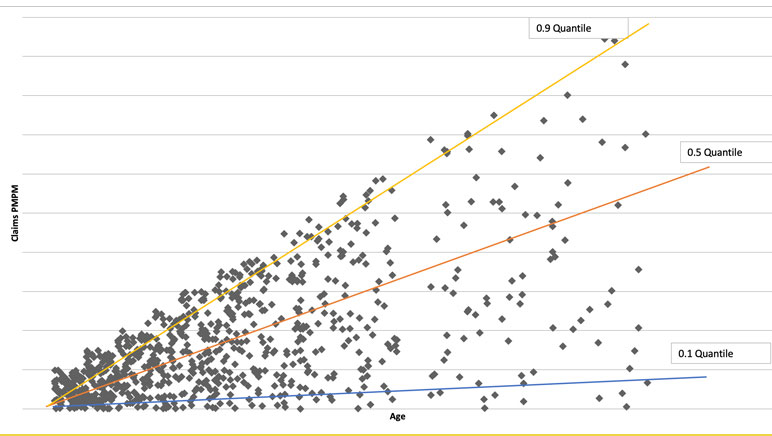
Ordinary linear regression predicts the mean, conditional on predictors. Quantile regression predicts the conditional median or any other percentile, with different coefficients (contribution to risk) at each level. The quantile chart (See Figure 1) suggests that the impact of increasing age is less for healthier members than for the sickest, with the slopes of the lines quantifying the difference.
Figure 1
Quantile Chart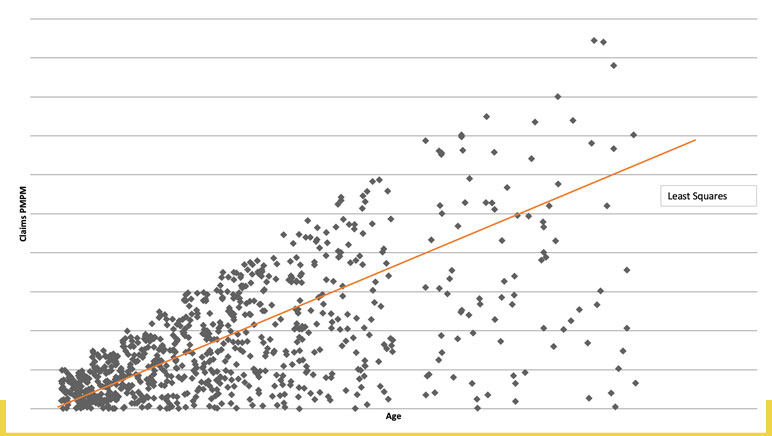
Each individual has a unique claims distribution that can be statistically estimated based on age, gender, morbidity, Rx utilization, etc. We can move from a single dimension to understanding risk along three dimensions:
- High expected costs (traditional risk scores),
- uncertainty due to wide range of possible costs with significant probability (high variance), and
- potentially catastrophic costs in the tail of claims distribution (rare high-cost events).
We can then use stochastic simulation to aggregate to group-level distributions with the distribution of claims varying significantly, affecting allowed and paid differently (when paid dollars are a nonlinear function of allowed, as happens with deductibles and out of pocket maxima). These claim distributions can be used to accurately quantify risk at high percentiles of the distribution (i.e., 99th percentile) to better price specific and aggregate employer stop loss risks. Premium would be set as expected payout with the probability of stop loss payments varying based on morbidity and adjusted based on relative tail risk (i.e., likelihood of loss). With the group morbidity distribution modeled, we can estimate individual and group probability ISL and ASL claims at any threshold. We can also determine expected amounts exceeding a given stop loss deductible. Each group, based on its own morbidity and demographics, will have a different probability of specific and aggregate loss exceeding expected.
Using claims probability with a rules engine can identify the highest risk individuals for renewal medical underwriting. This allows an insurer to manage limited underwriting resources by directing them to the highest priorities for review and using traditional UW predictions for the remainder. We can also use excess risk expectations by member to laser emerging large claimants. We can determine appropriate risk thresholds for lasered individuals to minimize risk to the health plan.
Modeling Extreme Events
When trying to model a distribution, we naturally focus on where the majority of information is, but central distribution patterns often deviate significantly from behavior in tails. We need to pay special attention to this behavior to not get overwhelmed by central tendency. Examples of heavy-tailed distributions are health claims and catastrophic flood losses. We want to model the distribution of claims above a threshold (like $100,000) and derive asymptotic properties of tails, but data is sparse there.
To model the extreme tail of the distribution, there are several classical statistical approaches:
- Maxima of events in a block instead of sums,
- use average of k largest losses (or other function of sum),
- expected shortfall given extreme loss (i.e., tail conditional expectation),
- sum of excess losses over a threshold, and
- Return Level (i.e., level expected to be exceeded in one of out of k periods of length n).
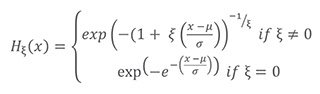
Theory indicates that when independent and identically distributed, both block maxima and peaks over a fixed threshold will converge to a Generalized Extreme Value Distribution, allowing us to model only a few parameters instead of every percentile:
Not Actuary Versus Machine, Actuary and Machine
We have presented a summary of effective applications of machine learning to actuarial and underwriting problems. We have also mentioned some caution that should be exercised in employing these models both from a regulatory and a business perspective. However, those considerations should not prevent us from taking full advantage of the power of machine learning. A study lead by Sendill Mullainathan, published in Jon Kleinberg et al., “Human Decisions and Machine Predictions,” NBER Working Paper 23180, February 2017 was quoted in Talking to Strangers by Malcolm Gladwell. This study compared the results for human judges versus machine learning in whether to impose bail upon defendants. The study found that those defendants released without bail from the machine learning algorithm were 25 percent less likely to commit a crime than those released without bail by the human judges.
We feel that in an actuarial and underwriting context, machine learning can likewise significantly improve results. For a moment, consider how actuaries are like or unlike the judges in this study. Here are three possible answers: 1. Actuaries do apply judgement based on their professional experience; 2. actuaries look at the numbers, not the human beings underlying the numbers; and 3. actuaries utilize models, tempered prudently by their professional judgment. Although machine learning can inappropriately be described as a black box model, in the hands of an actuary exercising their professional judgement, machine learning can provide insights that would not otherwise be obtained.
Statements of fact and opinions expressed herein are those of the individual authors and are not necessarily those of the Society of Actuaries, the newsletter editors, or the respective authors’ employers.