Meet Hybrid Data: A Blend of Alternative and Traditional Data. A Case Study to Construct an Improved Inflation Index

New sources of financial information that go beyond the typical company filings, earnings calls, or fundamental datasets may provide an unused source for creating alpha and better risk management procedures. These alternative data[1] are increasingly looked at by investors for accurate and granular insights, metrics, and forecasts that may give them an edge over their competitors.
A form of this alternative data is gathered directly from consumers in a scientific and privacy compliant manner. The data goes beyond a swiping of a card to the motivations and intentions of the consumer who uses the card. This type of data has been used to successfully forecast sales, produce economic predictive signals such as recessions and future purchase intentions across categories and down to specific retailers. In some cases, such alternative data[2] can help us improve upon existing traditional data that has many known drawbacks.
In the following article, I introduce the concept of “hybrid data,” a combination of alternative and traditional data (Figure 1), which I illustrate through an example on inflation, to be of better value than considering purely a traditional data or alternative data source alone. We present a case where we use alternative data from Zillow, to improve upon the Consumer Price Index (CPI), and thus create an index that is more pertinent to consumers and investors alike.
Figure 1
Hybrid Data as a Combination of Traditional and Alternative Data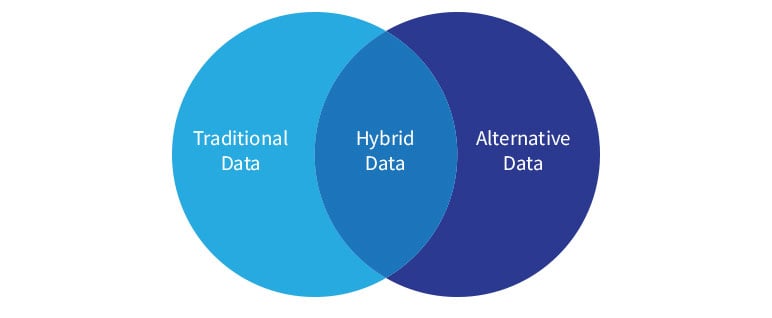
Economic Background and the Need for a Hybrid Index
Decades of falling inflation can easily be observed through lower bond yields if one were to use them as a proxy, with developed markets yields in Europe further into the negative territory. For consumers, the record lows on 30-year fixed mortgage rate in the last year can highlight the falling costs of borrowing on their home loans.
But something did change in the last few quarters. The Congressional Budget Office estimates that even without the new stimulus recently enacted, the gap between actual and potential output would shrink dramatically by the end of 2021. Unemployment, too, is falling fast and may early this year regain the levels before the pandemic. In particular, the indicators in the housing market, sales of existing homes, new home sales and median prices are all suggestive of an upcoming surge in inflation.[3]
The CPI from the Bureau of Labor Statistics is a common measure of inflation that is monitored by analysts. The federal government uses the CPI to make inflation adjustments to some of the benefits disbursed, such as Social Security—interpreted as the pricing of liabilities due in the future being adjusted for by CPI inflation. CPI, however, has some drawbacks, which renders it incapable of capturing the true extent of inflation or disinflation that consumers face. It is in this regard that an improved index must be introduced to further our understanding of inflation and the necessity to capture its components correctly.
Why Insurers Need an Improved Inflation Index?
Insurers are affected by specific components of CPI and inflation in general, and both by rapidly falling and rising inflation. For example, higher inflation increases the cost of medical care reimbursements by health insurers, denting their profit margins. Long-term care products needed repricing in the aftermath of lower interest rate regimes as well as the increasing cost of care. Auto insurers are affected by increasing or falling costs of automobiles and parts. Home insurers are impacted by house price inflation and climate costs. Policyholders can minimize the impact of inflation by taking steps like indexation, policy riders or periodic coverage boosts.
Indexation links premiums with any number of figures intrinsically tied to inflation, such as the Retail Price Index and the Average Earnings Index. As a result, a policy stays on par with the economy as inflation naturally occurs, retaining its long-term cash value over the course of many years. A policy rider is a clause built into a policy that provides extra protection or includes some other customized benefit that does not factor into a standard plan. Finally, one can inject additional coverage into your policy on a regular basis to keep up with inflationary needs.
Understanding the CPI Construction Methodology
Step 1: Create a Consumer’s Basket of Goods and Services
It is important to understand what a basket of goods and services is and how it is made before the CPI construction. The basket of goods and services consists of a variety of goods and services frequently used by people and this includes products like food and beverages, transportation, housing, clothing, medical care, entertainment, education, communications, and other goods and services.
To construct a CPI, first households’ surveys are done by economists to gain information about the buying patterns of consumers, understanding their frequently purchased goods, and their daily spend on these products. Almost 15,000 families provide the above-mentioned information, and a basket of goods is made based on this collected data.
For this data, a specific product in one category is selected from a particular outlet or shop to be priced. The more popular a product is among people, the more likely it is to be selected. For instance, if a 4 oz. bottle of ketchup makes up 60 percent of all sales of ketchup at the outlet and the same brand of ketchup in 6 oz. or 8 oz. makes only 20 percent of all ketchup sales, it is likely that the 4 oz. bottle will be selected for pricing as it is more popular. After different things are taken into consideration, a single type of product gets chosen, as in our case with 4 oz. ketchup bottle. This specific product will be priced at the same outlet each month.
The process of repricing of the selected item will continue after every month or every other month until a new product is selected after four years. This step is taken periodically to ensure to include a popular product and remove ones that might not be popular anymore.
Step 2: Evaluate the Value of the Whole Basket
When goods of the basket are selected and priced through the above-mentioned method, it is time to calculate the total price of the basket. We know that size and weight of selected items in the basket are constant, the only thing that can change over time are prices. This is done to easily understand the change in the price of goods as time passes.
Assume that the basket of goods only contains three pineapples each priced in 2019 at one dollar. It also has two oranges, each priced in 2019 at 50 cents. So, the total price of the basket will become four dollars. This can be found by doing this simple calculation $1×3 + $0.50×2 = $4.00. Now, if prices fluctuate in 2020, we can easily find the total price of a basket of goods. In 2020, for instance, if a pineapple costs 1.25 dollars and one orange costs 60 cents then the basket of goods now costs $1.25×3 + $0.60*2 = $4.95. This is how the fluctuation of prices is observed over time, which has increased in this case.
Step 3: Appraise the Value of the Index Relative to Base Year
The CPI is not an absolute value, to calculate CPI, a base year must be considered, and CPI is calculated relative to that base year. The base year is a reference year to which all other years are set. In the US, the bureau of labor statistics sets the base value as an average index level (representing the average price level) for the 36 months covering the years 1982, 1983, and 1984 equal to 100. Here is a simple formula to find CPI by taking 100 as a base year: Consumer Price Index = [Cost of Basket(t) ÷ Cost of Basket (0)] x 100
Criticism of CPI
It is often reported that the CPI is not reflective of prices paid by consumers, and it is influenced by upward or downward bias—it either overstates or understates inflation. The academic community criticized the controversial nature of CPI and stated that CPI mostly overstates inflation. In 1995, Congress, aware of such criticism, commissioned a group of academic economists, led by Michael Boskin,[4] to study and report on the CPI. The resulting study, titled "Toward a More Accurate Measure of The Cost of Living" (often referred to as the Boskin Report), summarized the viewpoint that the CPI was upwardly biased.5 To understand the concept of bias in the inflation index, its different types are stated below.
Substitution Bias
This kind of bias appears if people change their buying activities as a response to the change in the price of a product. For instance, if the price of a product is increased then people are less likely to buy such product and their purchase will be reduced as compared to before. In this case, people will buy a substitute product at a comparatively lower price instead. Substitution bias thus arises if consumers change their purchasing behavior in response to relative price changes. Economic theory predicts that an increase in a good’s price will cause consumers to reduce their purchases of that good and instead purchase a substitute with a relatively lower price. This bias was explained in Boskin Report stating that substitution bias is a major source of bias in CPI value, making CPI values controversial.
Quality Change Bias
This bias appears in CPI values because changes in the quality of new and older products are not considered. This is an important reason behind upward bias in CPI. Although, others still believe that due to the adjustments in the quality of products downward bias appears in CPI. Capturing novelty and innovation are other drawbacks in the CPI. Products do not become included in the CPI's basket of goods until they become staple purchases by consumers as seen over time. So even though new products may represent considerable consumer expenditures, they may still be years away from possible inclusion in the calculation of the CPI.
CPI Is Not Specific to One Individual
This is another shortcoming of CPI. This problem arises because CPI is a general value that is designed for a population of people and may not be accurate for one individual specifically. CPI value is calculated for a basket of goods of a large group of consumers in an urban area. But if we look closely each person in a large group has his/her specific basket of goods because they make unique purchases as per their own needs. So, the people whose basket of goods is not similar to the average basket will face differentiate inflation. For example, a person whose biggest expenditure is on fuel and gas will face higher inflation than the person who spends most on clothing or household appliances. So, the experience of inflation by one individual depends on his/her unique purchases. This phenomenon is not considered in CPI as it is designed as the average value for a larger population
A Hybrid Inflation Index From Alternative Data
Below I describe a methodology to construct a hybrid inflation index adjusted for specific components where alternative data is available and is more transparent than the one currently used. The hybrid data-based methodology is partly able to identify and make corrections for some of the biases listed above.
The hybrid data construction method starts with one of the largest components of CPI to avoid making assumptions on items that are material only to a few people and not the larger population. For instance, according to the U.S. Bureau of Labor Statistics (BLS), the shelter index is a major part of CPI value and makes up 30 percent to 40 percent of total CPI value. The shelter index measures the costs related to housing, which does not include investments or upgrades. There are two major parts of the shelter index named as owner’s equivalent rent or OER and rent of primary residence. They both make 23.6 percent and 7.6 percent of CPI values respectively. The cost of shelter for renter-occupied housing is rent, while owners’ equivalent rent measures homeowners’ expected rent if they were renting their homes in the current market.
The BLS analyses this cost of rent and OER to observe the overall effect of House Price Appreciation (HPA) on CPI value. HPA is the biggest item or service in the baskets of goods and makes almost one-third of the total CPI value. The BLS does not consider the prices of the houses as they are considered investments. Instead, BLS considers rents, which as a service can be used as a component of CPI. The BLS housing data of inflation is not based on the market data for rents and prices; instead, it is based on a consumer expenditure survey of homeowners. The homeowner thus decides what their primary residence would rent for if they tried to rent it out. The BLS thus extrapolates this rent-as-a-service to homeownership.
To avoid the above pitfall in extrapolation, we use Zillow Home Value Index (ZHVI)[6] as an alternate source of data that can be used as a proxy for owner’s equivalent rent of residence. The ZHVI is a smoothed, seasonally adjusted measure of the typical home value and market changes across a given region and housing type. It reflects the typical value for homes in the 35th to 65th percentile range. Consider that the “owner’s equivalent rent of residence” accounts for W percent of CPI. If it had increased by A percent, in line with the Zillow Home Value Index (ZHVI), instead of B percent, the overall CPI would have increased by 24.2 percent*(A – B) percentage points more. So, one would need to add the W percent*(A – B) percentage points to the reported overall CPI increase of X percent. And the thus corrected overall CPI would have shot up by Y percent.
Corrected overall CPI (Y)
= Overall CPI (X)
+ Weight of Component to CPI(w)×{Alternate data based increase (A)
- Current change in CPI component(B)}
The corrected overall CPY is a hybrid data series that is constructed from traditional as well as alternative data. We have used January 1996 as the base year, from which the alternative data source ZHVI is made available. Chart 1 shows the current uptick in inflation otherwise not captured using tradition data sources.
Chart 1
CPI and Modified CPI Using Hybrid Data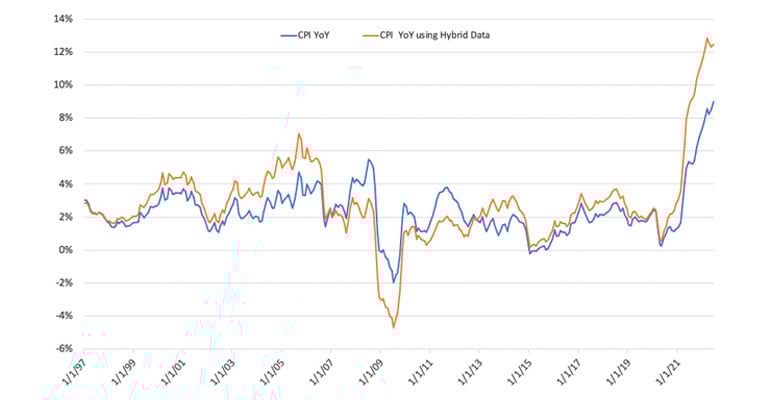
The larger population may feel their cost of goods are tied to the hybrid index rather than the CPI. Though volatile, it is more reflective of what we see in our surroundings. Hybridization of data using traditional and alternative sources gives us a middle of the road framework, rather than discarding one source in favor of the other. Our expectation is thus to formulate a method that is easier to adopt and to extract value out of from the resulting data series, which can be easily interpretated and explained to analysts.