Abandon the Spreadsheet and Go Digital

As one of the standard digitalization initiatives, we have seen big data, data science, artificial intelligence (AI), and machine learning departments set up in many companies. While these new departments are using new-generation digital technology such as the database, ETL software, visualization software, etc., the rest of the firm (the actuarial, finance, operations departments and so forth) are still working with old-school technology like the spreadsheet. Thus, a dichotomy is created in a firm where senior managers are using smart phones (modern technology) to view reports produced with old-school technology. A problem arises when a senior manager, used to modern technology, wants an instant response but is told to wait for a few days. We know in this fast-changing competitive world, a few days might mean lost opportunities worth millions of dollars. Therefore, in order to improve efficiency and fulfil the ever-higher management and regulatory demand, we must abandon the spreadsheet and go digital.
This article is organized in the following parts:
- Looking back at the spreadsheet, why does it hinder efficiency?
- What do we do now to go digital?
- Where will digitalization take us in future?
1. Looking Back at the Spreadsheet, why Does it Hinder Efficiency?
The first electronic spreadsheet VisiCalc was introduced in 1979. It was an all-in-one product with storage, calculation, and visualization capabilities. At the technology level of that time, its spreadsheet design made it a killer application and turned the computer into an indispensable business tool. However, modern technology has made tremendous progress. Such a design is becoming a hindrance for higher efficiency.
Figure 1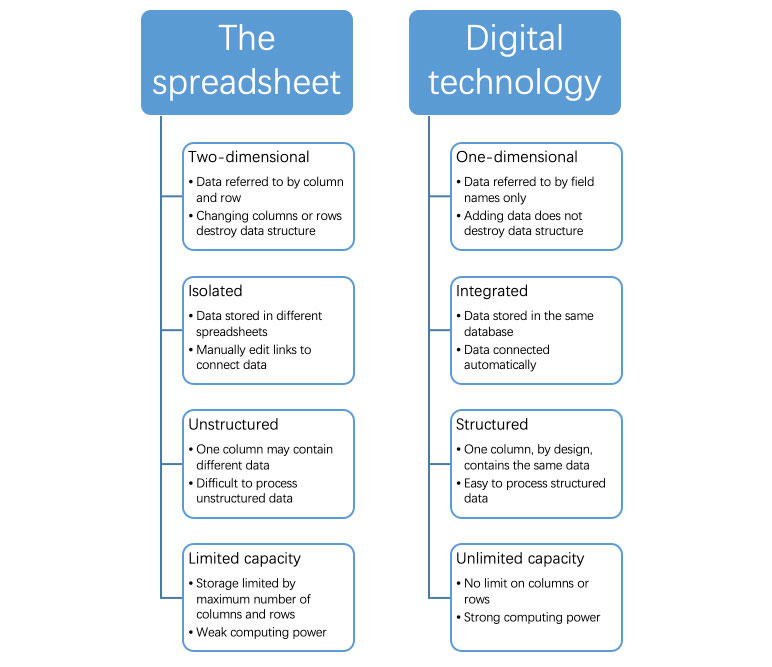
Two-dimensional Geographic Design Versus One-dimensional Design
A spreadsheet is a geographic map made of columns and rows. Data are stored in geographic cells. When we refer to a piece of data, we do not do so directly on the data. We actually refer to the cells where the data sit. For example, when we calculate NBP%, we cannot directly type a formula “NBP%=NBP/APE.” Instead, we have to translate the formula into a geographic reference and type “=G2/B2” to get the Agency NBP% in 2019. Such mental translation is done manually and can hardly be automated. This means a loss in efficiency.
Example 1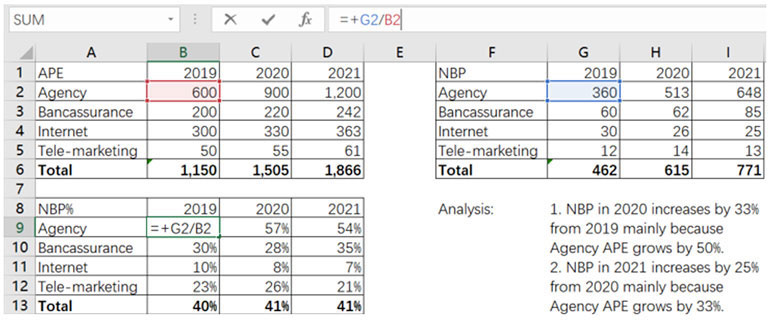
Furthermore, changing columns or rows may destroy data structure. In the example above, if we add a column between Column G and H, we destroy the NBP table. Besides, if we have another spreadsheet (called Spreadsheet B) that takes the Agency NBP in 2020 by reading the original Cell H2, it will still read Cell H2 but capture the wrong data. Constraints like this are common with the spreadsheet. Hence, after a template is designed, we often do not change it for fear of destroying the data structure. When new data come in or new demand arises, we often make a work-around instead of altering the original template. This adds a lot of maintenance friction and decreases efficiency.
However, such mental translation and maintenance hassles are made redundant with digital technology. In the world of digital technology, data are identified by field names. The location of the field does not matter. We do not need to translate a formula to a geographic reference. A formula of “NBP/APE” will suffice. Besides, the table below (called Table A) remains intact after inserting a new field “Product Type” between “Channel” and “APE.” A reference to Table A’s “APE” still works, though the field “APE” has moved from the third column to the fourth. Thus, the one-dimensional nature of digital technology removes many steps that are necessary in the spreadsheet and hence improves efficiency.
Table A
|
Year |
Channel |
APE |
NBP |
|
2019 |
Agency |
100 |
10 |
|
2020 |
Agency |
200 |
20 |
Isolated Versus Integrated
Data are stored in different spreadsheets. We need to manually edit links to connect them. Such an isolated manner decreases efficiency and prevents us from benefiting from big data.
In comparison, data are stored in the same database. Various data tables can be connected real-time with database functions. It saves the trouble of having to open multiple spreadsheets and synchronize data. Besides, when data are connected, they become big data. For example, when APE, NBP, claims, dividend, etc., data are joined together, we may have a clearer understanding of the life cycle of every policy.
Unstructured Versus Structured
There is no limit on what data are put in the same column in a spreadsheet. This makes it hard to process the data. In the Example 1, Column B contains various data such as Year (Cell B1), APE (Cell B2:B5), APE sub-total (Cell B6), and NBP% (Cell B9:B13). When we want to get a sum of APE, we cannot sum up the whole column B. Instead, we have to limit the range and type “=SUM(B2:B5).” What if a new channel is added in Row 6? We have to alter the formula manually to “=SUM(B2:B6).” With some good practices, we may minimize manual adjustment but we cannot eliminate it. Such manual adjustment lowers efficiency.
In contrast, an SQL database is structured by design. For example, unlike in a spreadsheet, we cannot mix two fields of different data types in one column in a database. The trouble of manual adjustment is eliminated. It is easy to process data and hence improves efficiency.
Limited Capacity Versus Unlimited Capacity
The spreadsheet has limited capacity. For example, the maximum number of rows in Microsoft Excel is 1,048,576. The amount of data we work with far exceeds this number. Besides, Excel is slow when processing data of such scale. In addition, Excel VBA is a single-core program, but we are already in the multi-core CPU era. Hence, Excel VBA cannot fully utilize the computing power of modern computers.
On the other hand, a database has no limit on the number of rows. ETL and visualization software may also process 1,048,576 rows of data with ease. If we go cloud, the capacity is unlimited. What used to take a few minutes to calculate in a spreadsheet can now be done in seconds in ETL software.
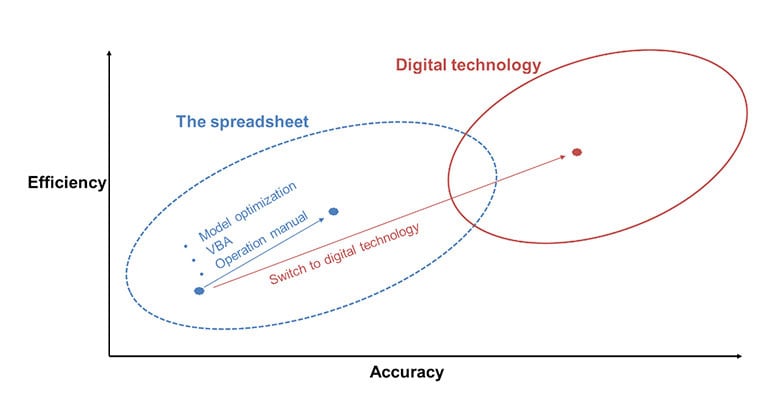
Therefore, we see how the spreadsheet is hindered by its own design for higher efficiency. Though we may improve efficiency through model optimization, VBA, and a well-written operation manual within the spreadsheet paradigm, the improvement is modular at best. We will make a quantum leap if we make a paradigm shift to digital technology. The effect is akin to upgrading from a car to an airplane.
Figure 2
2. What do We do now to Go Digital?
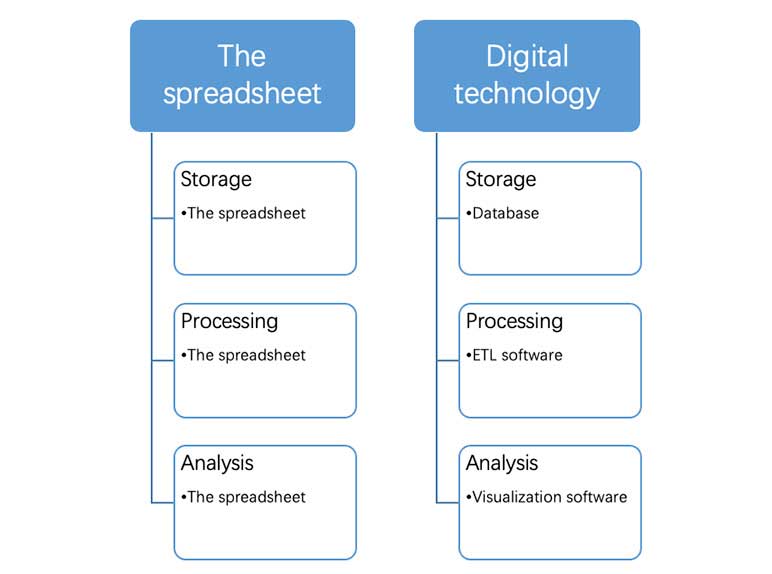
We may divide a data process into three stages: The data storage, data processing, and data analysis stage. In the data storage stage, raw data, intermediate data, and result data are stored in a database. In the data processing stage, data are processed by ETL software. In the data analysis stage, we analyze data with visualization software.
Figure 3
Below is a list of commonly known brands. The list is not exhaustive. The mention of any brand in this article is not an endorsement for any vendor.
Table B
|
Digital technology |
Open source example |
Commercial example |
|
Storage software |
MySQL, etc |
Oracle, Alibaba Cloud, etc. |
|
ETL software |
Kettle, etc |
Alteryx, Informatica, etc. |
|
Visualization software |
Redash, Superset, Metabase, etc |
Tableau, QlikView, etc. |
Similar to the spreadsheet, ETL and visualization software operate in a low-code environment. The drag-and-drop functionality gives us the same freedom that the spreadsheet gives to create data flows without the hassle of coding. Some may propose using tools such as Python, R, etc. But they are heavy coding languages and hence, not friendly to the masses.
In one of my digitalization projects, a workflow used to take four hours to call values from a Prophet workspace and store them in 96 Excel workbooks. It took another four hours for a macro to process the data in the 96 workbooks and form a table with 275,953 rows. It took me an hour to analyze the results. After rebuilding the workflow with digital technology, the values in the Prophet workspace are automatically stored in a database. It takes Kettle four minutes to process the data and form the exact same data table. The time to analyze the results is also shortened to 30 minutes with Tableau. In total, the time shrinks from 540 to 34 minutes.
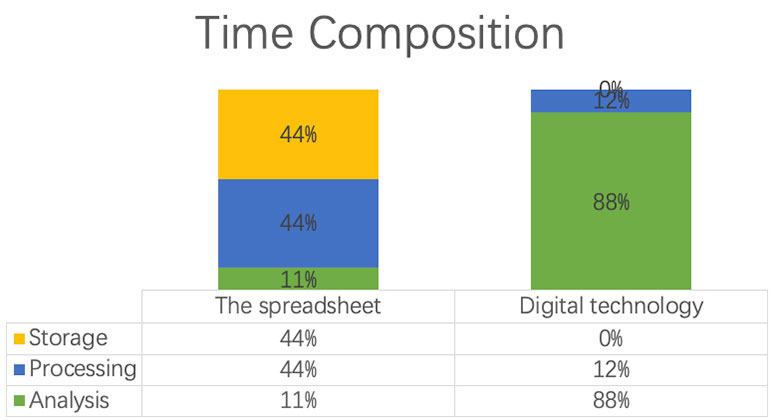
Two important lessons are drawn from this case study. First, efficiency improves by 16 times. Secondly, time composition changes drastically: The data analysis stage used to take only 11 percent of the time, but now takes 88 percent of the time. Digital technology releases us from mundane tasks in the data storage and processing stage and lets us spend more time in higher-value tasks in the data analysis stage. The implication is far-reaching. In how much of our work do we have the luxury to devote the majority of the time to analysis? How much of our staff is not engaged in the data analysis stage?
Click here for a sample of the report for demonstration purpose.
Figure 4
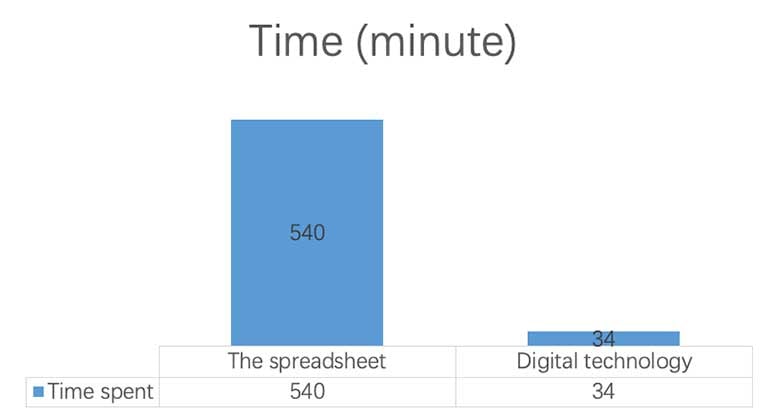
Figure 5
Given the benefits of digital technology, the company that adopts it first will gain competitive advantage over the market. It is better that we embrace it sooner rather than later. First of all, we need to change our mindset. Some may narrow-mindedly think that digital technology is an “IT tool” and is exclusive to the IT staff, the data scientists, or the business intelligence (BI) analysts and that actuaries work with “actuarial software” such as Excel, Prophet and so on. However, the line is not so clearly cut because both “IT tools” and “actuarial software” are but processing engines. We should adopt it as long as the software helps us do our work more efficiently and accurately.
Once our mind is set, we next need to secure management support with a lighthouse project like the case study above. Management support in terms of time, money, and human resources is needed as it is a transformation endeavor where old ways of working are being torn down and new ways are being established. In a lighthouse project, we rebuild a small-scale workflow with digital technology. It serves two purposes. First, it verifies the benefits of the digitalization effort, proves that the management support is worthwhile, and obtains further commitment. Second, project members learn and build up new skills with digital technology.
With proven success of the lighthouse project, we are ready to scale up. We may set up a catalyst department staffed with a database expert, an ETL expert and a visualization expert. When digitalizing a workflow, the operator of the workflow and the three experts form a catalyst team. The operator conveys the logic of the workflow to the experts while the latter multiply digital technology skills to the former. Together, the four rebuild the workflow. I emphasize “together” here because it is not a consultant-client mode where the experts (the consultant) build a heavy rigid system and deliver it to the operator (the client). The operator often ends up doing work offline and submitting work online to the heavy system. Instead, it is a “together” mode where both the experts and the operator work hand-in-hand and at the end of the project, the operator is able to self-service and independently run, debug and modify the workflow. The experts must be present in every catalyst project because they ensure that all workflows are standardized and adhere to the best practices.
Therefore, we will digitalize the rest of the firm in a “together” mode with catalyst teams. The whole firm (as opposed to select new departments) will be empowered to work more efficiently, beating the competition.
3. Where Will Digitalization Take us in the Future?
After digital technology automates the data storage and data processing stage, the next step is to automate the data analysis stage with the help of AI. What if the computer automatically tells us what KPI changes and why?
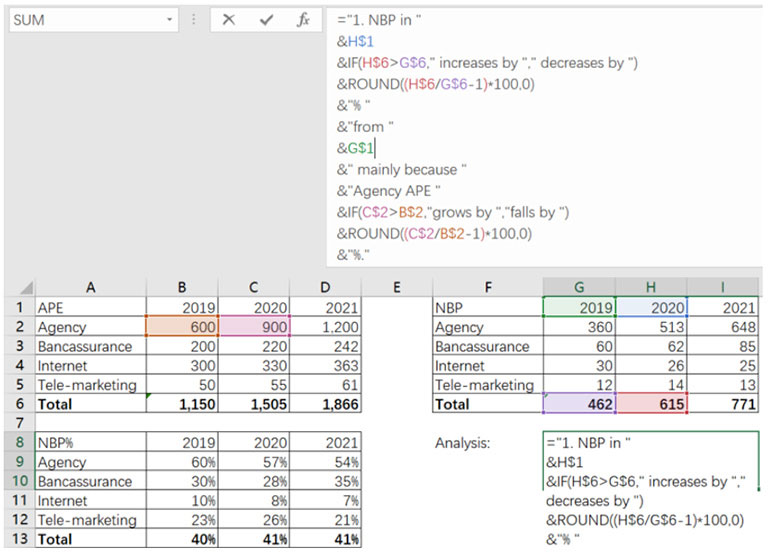
It is indeed a daring idea as analysis is a complex process. However, it is not improbable as ChatGPT has demonstrated. In fact, it is not as remote as some may think. Example 2 shows a very primitive form of AI: The analysis is actually written by the computer! Such automated analysis removes the potential for human error and improves efficiency. Limited by the current level of technology, it is useful for routine reports for the time being. Nevertheless, it points us to the right direction.
Example 2
A right move in the AI direction is to first digitalize our work and create a metaverse with big data in the data storage stage and the computing power in the data processing stage. For instance, when APE data, NBP data, client data (clients’ profile), sales data (which agent sells what policy), pre-sales data (agents’ conversations with clients), etc. are stored and connected in a database, they become big data. The computer needs massive computing power to process the big data in order to identify the best sales technique that drives APE and NBP.
Therefore, digitalization is strategically important and will lay a solid foundation for the next wave of automation: AI.
Conclusion
In conclusion, let us put ourselves in the shoes of a business owner. Increasing revenue, reducing costs, and improving efficiency are the yardstick against which we evaluate our work. Digitalization, with its potential to make a quantum leap in efficiency, should be made a priority. Many companies have started digitalizing by setting up big data departments, etc., and investing in heavy systems, but the real battle is to digitalize the incumbent departments that are predominantly spreadsheet-users. After decades of technological advancement, we have come to a point where the spreadsheet, hindered by its inherent design, has become a bottleneck for higher efficiency. It is time to put aside the spreadsheet and embrace digital technology. I propose doing it in a “together” mode with catalyst teams as opposed to the “consultant-client” mode. Once a metaverse of the firm is created with digital technology, we will be strategically well-positioned to improve efficiency further by automating with AI. The future is exciting. So let us abandon the spreadsheet and go digital.
Statements of fact and opinions expressed herein are those of the individual authors and are not necessarily those of the Society of Actuaries, the newsletter editors, or the respective authors’ employers.