Predictive Analytics Hack-a-Thon 2022
The 2022 Predictive Analytics Hack-A-Thon (HAT) in Toronto was a part of the joint Predictive Analytics Seminar of the Casualty Actuarial Society, Canadian Institute of Actuaries, and the Society of Actuaries. Rather than being a four-hour competition like previous years, it was a weekend competition from Friday evening, May 13, to Monday morning, May 16, which was a few weeks prior to the conference on June 9. As a part of the conference, there was an hour-long presentation to announce the beginner and expert competition winners and let them describe the methods they used to win. I will take you through the major highlights of the competition and the presentation on June 9.
There has been quite an evolution for the HAT over its four short years. If you want to learn more about its history, I highly recommend reading this Hack-A-Thon explainer on the SOA website. The HAT had both beginner and expert competitions. Both competitions used the same datasets, which were taken from a database of the houses sold in California and Arizona during 2020. The data contained various home characteristics, such as previous sold price, last sold year, number of bedrooms, etc. The competition's goal was to predict the 2020 sales price of the houses in both states. The only difference between the two competitions was that for the beginners, we stripped out some of the text fields, cleaned the data a little bit, and made sure to leave predictors that had predictive power. This data preparation focused the beginners on the correct path and reduced the complexity of the competition.
Winning the Competition
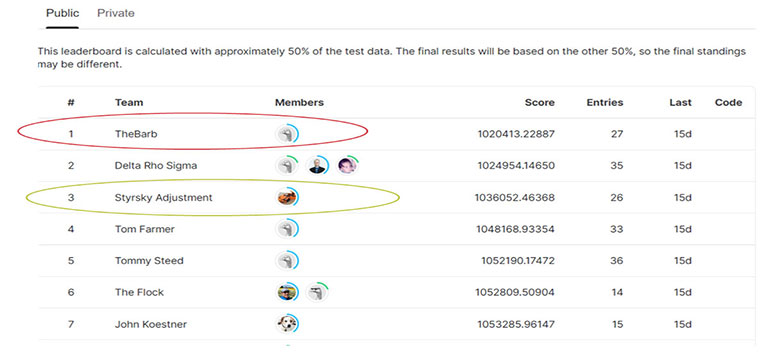
For the 2022 competition we upgraded and used the Kaggle predictive analytics competition website. (By the way, creating a custom competition on Kaggle is remarkably easy and free! We will never go back to the days of emails and Wufoo form submissions.) Kaggle was an immensely needed upgrade that came with many benefits. An interactive leaderboard made the competition a lot more fun because everyone could watch where they were in their standings during the competition. But this convenience has an added twist because it was easy to focus on the public leaderboard. You can see below that the final public leaderboard has Styrsky Adjustment in third and The Barb in first.
But now, look at the final private leaderboard in the picture below. Styrsky Adjustment moved to first and The Barb moved to 14th.
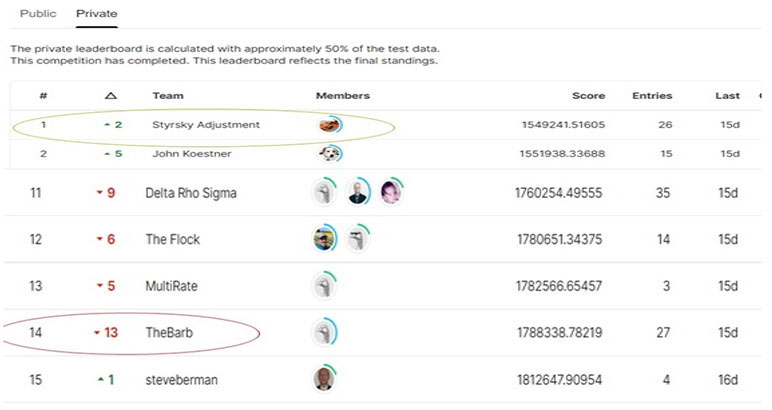
How does this happen? To set up the competition, you feed it a training and test set. Kaggle will divide the test data into two pieces: One for the public leaderboard and one for the private leaderboard. The contestants can only test against the public leaderboard. The competition's winner is inevitably judged based on the private leaderboard, which no one can use for testing. The private leaderboard ensures that the submission correctly generalizes the problem. I don’t know exactly what happened with The Barb, but I speculate they focused too much on validating against the public leaderboard, which is a well-documented trap for Kaggle contestants.
Bias/Variance Trade-off
To better understand the issue, let us look at this through the lens of the bias/variance trade-off. A highly biased model is likely to underfit the data because there are not enough predictors in the model.[1] For example, modelers use a straight line for a model whose underlying distribution is a parabola. This straight line model is biased because the accuracy doesn't change much with new data, which is unfortunate because the fit will remain poor. Conversely, a high variance model will have excessive sensitivity to small changes in the dataset. Therefore, it will tend to overfit the model, and the fit will be very sensitive to a new dataset.[1]
As beginners we are taught to perform data science with the following process:
- Make an 80/20 split of the provided training data between their training and testing split and keep it consistent for the life of the competition;
- train the model on the training set;
- test the model on the testing set;
- once a substantial improvement is achieved, run the model against the public leaderboard's testing set; and
- repeat until the competition is over.
This algorithm sounds like it should work, but this is building a high variance model. This algorithm overfits the public dataset, making achieving the highest public score a deceptive target. The purpose of the public out-of-sample test set has been defeated by repeatedly testing against it. You want to be high in the general standings, but being number one does not imply you are winning!
It's All About That Validation
How do you avoid this problem? By adding bias into the model and not focusing so much on the leaderboard. To add bias to the model, contestants should perform some type of validation by using different sections of the data for training versus testing, such as k-Fold Cross-Validation. The k in K-Fold is the number of randomly selected sets of equal size.[2] The first fold is held out as the test set. The other k-1 folds become the training data. This algorithm will train the model k times on each one of the folds. The mean and standard error are reported for each fold so that the team can choose the best model.
How many folds, i.e., the value of k, should I choose? Think of the dataset as a big Thanksgiving pumpkin pie. The folds are the number of slices of that pie. The smaller the pieces will get as more people want a slice of pie. As the slices shrink, the test set will get smaller, adding more variance and less bias to the result.[2] The typical values of k are usually five or 10. The smaller the value of k, the more bias that will add to the results. The beginner and expert teams picked five-folds, creating more bias, which allowed them to win the competition.
Winning Submissions
The expert and beginner competitions ended up using the same algorithms. I will focus on the expert's submission from here on out. Here are the models used by the expert and the reason given by the winner:
- Random Forest because it is robust to overfitting,
- XGboost because it has good performance with missing values, and
- CATboost because it is easy to handle categorical features.
These are all tree-based models, which data science competitors often use because they handle non-linear interaction well. They are listed above in the order of their conception, which was 1995, 2014, and 2017,[5] respectively. Let's break down these algorithms so that it is possible to get a better understanding of how they work.
Decision Tree
These three algorithms start with classification and regression trees (CART) or decision trees. A decision tree is exactly as the name implies. It creates a binary tree based on user-specified predictors. The threshold for a specific feature dictates the decision of the left or right branch. For simplicity's sake, assume each level represents a different feature. Each level will have its own binary decision to be made based upon its predictor, which is determined automatically by the algorithm. For instance, I have two predictors: Gender and age. The root node predictor could be gender with a binary decision of male or female. The next level uses age as a predictor with a binary decision of < 65 or ≥ 65. If I add another predictor, such as salary, another level is created. Its binary decision could be < $100,000 or ≥ $100,000. More predictors add more levels to the tree.
Decision trees have many upsides:
- They are easy to interpret,
- they can handle mixed discrete and continuous inputs,
- they are insensitive to monotone transformations,
- they perform automatic feature selection,
- they are robust to outliers,
- they deal with missing inputs with a bit of modification, and
- they can scale to large data sets.[3]
(A monotonic transformation is a way of changing one set of values into another set of values by preserving their order. In mathematical terms: If x1 > x2 implies f(x1) > f(x2))
But there is trouble in paradise! Decision trees have high variance.[3] A slight change in the data will mean the resulting decision tree will have a very different structure. The decision tree algorithm will find the threshold for the provided data with a greedy algorithm. A greedy algorithm always makes the choice that looks best at the moment. A greedy algorithm is required when no known algorithm can find the globally optimal partition for the feature within a reasonable time frame.[3] Furthermore, choices must be made in a particular order, creating a locally optimal solution.[4]
Random Forest
How do they solve the high variance problem? Data scientists employ the ensemble technique, which groups different predictions.[1] They can be different algorithms or the same algorithms. In our case, the ensemble is made entirely of decision trees, which will create a random forest. The random forest trains on both random features and random subsets of data[3] because ensemble methods work best when predictors are as independent as possible.[1] The ensemble will equally weigh all the trees based on the number of trees, called bagging.[3] The ensemble adds bias to the solution to help balance out the high variance of the individual decision trees. Boosting is required for a more sophisticated weighting scheme.
Boosting
Any ensemble method that combines several weak learners into strong learners is Boosting.[1] (For this competition, the weak learners were decision trees.) According to Machine Learning: A Probabilistic Perspective, "The greedy algorithm works by applying the weak learner sequentially to the weighted versions of the data. More weight is given to examples that were misclassified in earlier rounds. It was proven that performance could be boosted on a training set of any weak learner arbitrarily high, provided the weak learner could always perform slightly better than chance. What is … surprising is that the test set error continues to decline even after the training set error has reached zero (although the test set error will eventually go up). The boosting is very robust to overfitting.[3]”
XGBoost
XGBoost stands for extreme gradient boosting. Therefore, I want to focus on gradient boosting, even though there are many different types of boosting. Gradient boosting tries to fit the new predictor to the residual errors made by the previous predictor.[1] This is done by performing a functional gradient descent for predictors in a stagewise manner. The gradient descent algorithm is a greedy stepwise search process to find the minimum of a function. A learning rate dictates the speed of the descent. If the learning rate is too low, then convergence will be slow. If the learning rate is too high, it may not converge on the lowest point.[3] In gradient boosting, the learning rate handles the shrinkage hyperparameter, which controls how much each decision tree contributes to the ensemble. The lower the learning rate, the slower the algorithm will be, but the better it will generalize. Other hyperparameters, such as early stopping, help determine the optimal number of trees for the ensemble.
CATBoost
CATBoost is one of the newer boosting algorithms. According to the Introduction to gradient boosting on decision trees with Catboost, the main advantage of the algorithm is that it does intelligent processing of categorical data. There is no need to preprocess the categories on your own. Furthermore, it has a permutation-driven alternative to the classic boosting algorithm called ordered boosting. Ordered boosting works well on small data sets, which other boosting methods tend to overfit.
Conclusion
The 2022 HAT was an exciting, enjoyable experience, as always. Kaggle significantly improved the competition. It created dynamics and challenges that weren't a part of the previous year's competition. The most significant new dynamic was the leaderboard, which may have caused people to get too focused on the prize and overfit their model to the public leaderboard.
This year's winning algorithms were random forest, XGBoost, and CATBoost. All kinds of data science competitions very commonly use these algorithms. To better understand why these algorithms are so powerful, I introduced each and how they are related. I started with decision trees, which led to ensembles. The bagged ensemble of decision trees became the random forest. Building a more sophisticated weighting scheme for the ensemble led to boosting. The boosted ensemble of decision trees led to the XGBoost and CATBoost.
We are already starting to plan for next year's competition. This year's competition will be March 24-26. If you would like to sign up for this year’s competition then click here. Every year the competition draws more participants. I hope to see you at the competition this year!
Statements of fact and opinions expressed herein are those of the individual authors and are not necessarily those of the Society of Actuaries, the newsletter editors, or the respective authors’ employers.