By Steven Craighead
In this article, we will look at how to download worldwide earthquake data and load it into R and use the “maps” and “mapproj” packages to display the Ring of Fire using the earthquakes data.
Please consider installing the latest version of R for whichever operating system that you use. The commands below are consistent for both the latest Windows and MAC operating systems.
First you need to install the “maps” package, using your package manager. The website for the package is here. The “mapproj” package is available here.
The “maps” package has many great features, such as maps of Canada, France, Italy, New Zealand and the United States. Additionally, the package has two different world maps. The “world” map is Atlantic Ocean-centric, where “world2” is Pacific Ocean-centric. If you want maps of other countries, consider you can access them through the “world” map choice. The “mapproj” package allows you to use different methods of projecting a sphere to two-dimensional maps. We will be using the traditional Mercator projection method.
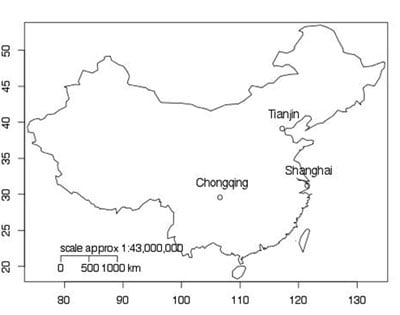
For instance, if you want to display the map of China, you need to use the following commands:
>library(maps)
>library(mapproj)
>map(“world”,”China”)
To add the capital and two provincial capitals, use this this command:
>map.cities(country = “China”, capitals = 2)
If the “capitals” parameter is set to 1, then only the national capital is shown. To add axes and scales to the map, use these commands:
>map.scale()
>map.axes()
Here is the final result:

There are many other features available with the “maps” package, and you can discover these by reading the associated package documentation or by Internet search.
Now, let’s create a map of the Ring of Fire. You can retrieve the complete earthquake dataset from the Advanced National Seismic System catalog, which is hosted by the Northern California Earthquake Data Center by using the link.
The link allows for you to specify the seismic data back from 1898 to present in various data formats by magnitude, depth, latitude and longitude. You can also choose which events to be extracted such as earthquakes, blasts or both. Also, you can extract events that have no magnitude and other advanced parameters. There are more than 2.6 million records, so you also need to set the line limit to obtain all of the output. To obtain an actual file, you need to send the output to an anonymous FTP site on the Northern California Earthquake Data Center site.
For my example below, I have chosen to output all of the data to a CSV-formatted file with these settings:
Your search parameters are:
catalog=ANSS
start_time=1895/01/01,00:00:00
end_time=2012/08/01,00:00:00
minimum_latitude=-90
maximum_latitude=90
minimum_longitude=-180
maximum_longitude=180
minimum_magnitude=0
maximum_magnitude=10
minimum_depth=0
maximum_depth=4000
event_type=A
Once you submit the request, the above information will be displayed and you need to wait (possibly several minutes), before the catalog search will return with a URL that you link to and download the file. For instance, for my file click here. Your results will be at the same location, just with a different number after the “catsearch.” I downloaded the “catsearch.4052” file into “catsearch.csv” in the directory of my R workspace.
I just used the “read.csv” function to load the information into R into the “x” object:
>x <- read.csv(”catsearch.csv”)
>names(x)
[1] "DateTime" "Latitude" "Longitude" "Depth" "Magnitude" "MagType" "NbStations" "Gap"
[9] "Distance" "RMS" "Source" "EventID"
The key fields from above we use below are the Latitude, Longitude and Magnitude.
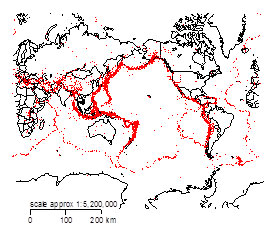
First let’s build a Pacific Ocean-centric world map using a Mercator projection with this command:
>map(“world2”,project=”mercator”, xlim=c(10,360))
You may get an error message stating that the Mercator projection may have failed for some of the data. I have limited the longitude to lie between 10 and 360 degrees, so that the projection does not add odd lines to the map.
To add the actual earthquakes to the map, you will use the points command in the following fashion:
>points(mapproject(list(y=x[x$Magnitude>5,]$Latitude,
x=x[x$Magnitude>5,]$Longitude)),col=2,pch=”.”,cex=1)
>map.scale(relwidth=.2)

The list command is used to specify the map coordinates for the “mapproject” function. Also, notice how the latitude and longitude is limited to just earthquakes (and blasts) greater than magnitude 5. The “col=2” specifies the color red in the graph. To limit the magnitude of the earthquakes displayed, in the “list” statement specify magnitude 5 and higher earthquakes when supplying the latitude and longitude values. The ‘pch=”.”’ parameter is set so that only points are displayed at each ordinate pair of longitude and latitude. The “cex=1” parameter specifies the size of the text and symbols displayed. The “relwidth” parameter used in the map.scale function, widens the scale, so that the numbers on the scale can be distinguished clearly.
Notice how the graph travels up the west coast of South and North America, moves west from Alaska and then traces southwest down the coast of Russia, China and Japan, and then heads southeast before reaching Australia, then back east toward South America. Observe how the Mid-Atlantic ridge is displayed on the right side of the plot. Since we have worldwide data, the earthquakes zones in the Indian Ocean throughout the Mid-East and the Mediterranean Sea are also displayed.
If you are interested in displaying the earthquake data from an Atlantic Ocean-centric map, replace the map command above with this:
>map(“world”,proj=”mercator”,xlim=c(-170,170))
From this map, you can observe that the mid-Atlantic ridge runs through Iceland.
As you can see spatial modeling is quite advanced in R, and with this example and using others in the map related packages, you can use R to display your own company data geographically.
Steven Craighead, CERA, ASA, MAAA, is an actuarial consultant at Pacific Life Insurance. He can be reached at steven.craighead@pacificlife.com.