By Paul Margus
Microsoft Excel Tables are excellent for manipulating data. This article will explain some techniques that have proved useful in my personal experience. My major theme concerns how to refer to data unambiguously. I hope to convince you of the advantages of referring to table data by column name. Instead of referring to data by column number or offsets, I will concentrate on using the title at the top of the column. It seems nicer to refer to “Face Amount” instead of “Column 5” or “3 cells to the left.” This is especially true if new columns are inserted, requiring revisions to the column numbers.
Once we’ve organized a table, we can sort our data on a wide range of criteria. Using built-in filters, we can hide selected data rows, showing only those of immediate interest. The Excel Table has an optional “Total Row” that can display totals for the visible (unfiltered) records. Tables impose certain rules that keep things neat. Column names must be unique. Formula references default to the column name rather than the usual row-column cell reference.
Excel Visual Basic for Applications (VBA) can process individual table records sequentially. In this article, I will show how to do this with a list of hypothetical policies.
Unfortunately, in VBA, column numbers and offsets are initially easier to master. In fact, it’s not at all obvious how to avoid them. But, VBA Class Modules can address this problem. They are typically short, sweet, but often a difficult struggle to design and write. Although Class Module concepts are often elusive, the three Class Modules provided here will serve as a practical example, if you wish to analyze my profusely commented source code.
But the real advantage of Class Modules is that they create a portable black box that we can use in a variety of situations, without getting under the hood. Microsoft doesn’t show us the innards of Excel’s built in Classes (Worksheet, Range, etc.), but we use them for a wide range of tasks. Similarly, these Class Modules are general purpose routines that insulate messy details from the rest of the VBA project. Therefore, I’ll demonstrate the high-level use of the Class Modules, without analyzing the source code in detail.
From personal experience, I admit that reading about these concepts is difficult and unpleasant to the newcomer. It’s far easier to learn by trial and error. Start with someone else’s code, modify it, and see what happens. And because they apply directly to actuarial work, the programs included herein may be easier to follow.
First to ground ourselves, let us go through the steps in creating a table of data. Note the companion EXCEL file with the full data set, Article_ExcelTables.xlsm. With the table defined, we can then apply VBA tools to manipulating the data, and illustrating several useful techniques in VBA.
ESTABLISHING A TABLE
Before creating a table, arrange your data as shown in Figure 1. Each row, known as a record, contains data for one entity (for example, a policy). The top row contains column headings of your choosing. Using them, you will be able to refer to your data by name.
Figure 1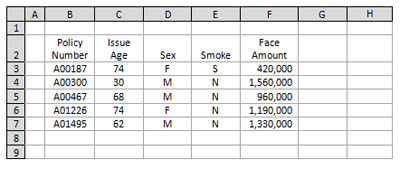
To create the table, select any cell in the array, and hit ctrl-T, or click the “Tables” icon in the “Insert” ribbon. Choose a color scheme, or let it default. Figure 2 shows the result.
Figure 2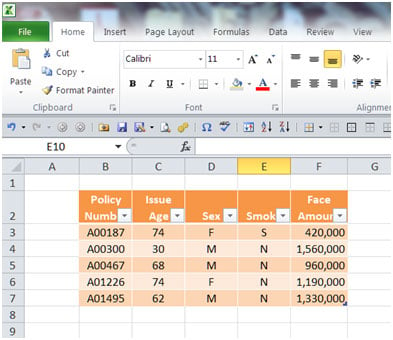
In Figure 3, we enter a formula in the usual combination of typing and clicking on the cell. Instead of generating something similar to “=0.001*F3,” Excel produces “=0.001*[@[Face Amount]],” referring to the data by name. And without any effort on our part, the formula propagates down the column. See Figure 4 (pg. 8, left, top).
Figure 3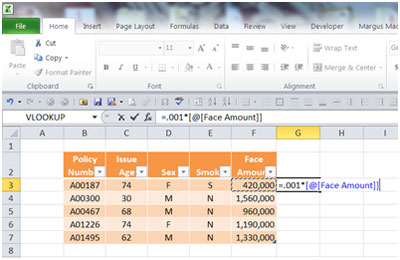
Figure 4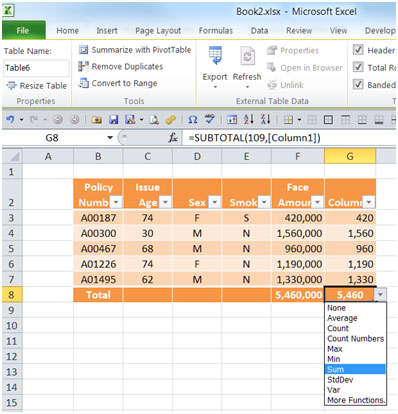
In Figure 4, I have also turned on the “Total Row” (in the “Table Style Options” group in the “Table Tools/Design” ribbon). The drop-down demonstrates how the “Total Row” can do sums, counts, and other aggregate functions.
Each column heading has a drop-down, which controls sorting and filtering. Filtering temporarily hides rows that aren’t of interest. In the “Total Row,” sums and counts are automatically updated to reflect only the visible rows. This is demonstrated in Figure 5 (pg. 8, left, bottom), in which I have filtered by Sex = “F”.
Figure 5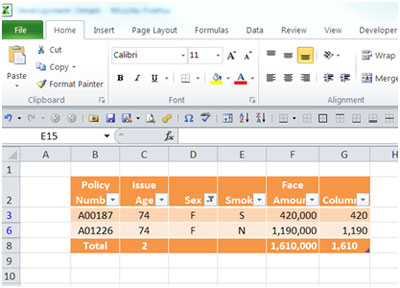
Sorting is controlled using the same dropdowns. For multi-field sorts, you can use the usual sort routine in the Data ribbon.
Excel Tables enforce a few useful constraints. Each column needs a column heading. If you insert a blank column, Excel inserts a default “Column7” or something similar. You can change it to a more descriptive name. The headings must be unique. If you try to use a heading name already in use, Excel appends an integer so that uniqueness is preserved.
For columns containing formulas, the formula can vary by row. However, such inconsistency is very bad form. For that reason, it requires some persistence to make it happen.
THE WORKBOOK
At this point, we have now constructed our specimen data tool, the file “Article_ExcelTables.xlsm”, a Microsoft Excel Macro-Enabled Worksheet. We are ready to explore the powers of VBA tools for manipulating data, illustrating several useful techniques. Although it was developed using Excel 2010, it should also work under Excel 2007. Because it contains VBA Modules, it will work only if VBA is enabled. To avoid damage from malicious software, you should enable VBA only for workbooks from trusted sources.
In this article, I have not discussed every feature in the workbook. But I have inserted comments into the VBA routines. Seeing these techniques in action is probably better than merely reading about them. Before you get too deep into this article, you may want to browse through the workbook, click the buttons, and examine some of the VBA code. The workbook consists of the following Worksheets.
- Introduction
- Policies: Contains an Excel Table (Policies_1) with hypothetical policy data. We will process this sequentially.
- InputOutput: This is where we calculate the policy values, one policy at a time. The VBA feeds policy data from Policies_1, and then harvests the results and sends them back to some empty fields in Policies_1.
- LookUp: Contains table_values, another Excel table. Rates (in this case, mortality rates from the 2001 CSO) are accessible using look-up spreadsheet functions.
Also included are some special modules (in VBA).
- Sheet02 (Policies): Short subroutines that are invoked directly by the buttons and hyperlinks. Their purpose is to call the subroutines in the general modules.
- ThisWorkbook: Automatically maximizes the Excel window when the workbook is loaded. If you don’t like this behavior, just comment out the code, or simply delete it.
The workbook also includes the following general modules (also in VBA).
- mod0000_Version_and_Filenames
- mod0101_Processing: Programs for moving data and results between the Policies and InputOutput worksheets.
- mod0102_Erase: Erases output for visible policies.
- mod9996_Filters
- mod9997_functions<
- mod9998_Utilities_Hyperlinks
- mod9999_Utilities_ListObject
Finally, the workbook contains the three Class Modules mentioned above.
- pListObj
- pListObjCol
- pListObjRow
The last four modules (numbered 9996 and above), as well as the Class Modules, can be recycled into other projects with little or no modification. Although mod0101_Processing contains explicit references to our special column names, it can serve as a template for other projects.
PROCESSING THE POLICY DATA
As mentioned above, the Policies worksheet contains an Excel Table (Policies_1) with hypothetical policy data. The “Process Visible Policies” button performs calculations on the visible (unfiltered) policies, and captures the results in the three right-hand columns. To process just one policy, click a hyperlink in the “Policy Number” column. Clicking in the adjacent “Erase Output Data” column erases the results of the one policy.
Behind the scenes are several subroutines in the mod0101_Processing module.
- The “Process Visible Policies” button runs the gsubProcess_MultiPolicies subroutine. It sequentially feeds data for each unfiltered policy, one at a time, to the OnePolicy subroutine.
- Clicking a policy hyperlink runs the gsubProcess_OnePolicy subroutine. It feeds the data for just one policy to the same OnePolicy subroutine. This feature is handy for debugging, when you may want to examine the calculations for a particular policy.
- The actual calculations are performed in the InputOutput worksheet. The OnePolicy subroutine first copies data for one policy from the Policies_1 Table (the [Policy Number]:[Key] column range) to the working area in the InputOutput worksheet. Excel updates the calculations, which involve an illustrative table lookup and some hypothetical math. Then, the OnePolicy subroutine copies the results (the [Premium (Base)]:[Premium (Waiver)] column range) in the opposite direction, from the InputOutput worksheet back to the Policies_1 Table.
LOOKUP
The mod9999_Utilities_ListObject module includes Function vLookUp_by_Name. It is similar to Excel’s VLOOKUP function. In fact, it uses it. But instead of providing a column number, you use the field name appearing in the table header. See InputOutput!O16 for a sample application. For large amounts of data, this routine is probably much slower than VLOOKUP, because VBA is never as fast as the built-in functions. There are more efficient methods, which could be the subject of a separate article.
I should mention the “key” field that the lookup uses. It combines several lookup parameters (table name, sex, smoke, and issue age) into one lookup parameter, as required by vLookUp_by_Name and VLOOKUP. More grist for an article.
UNORTHODOX HYPERLINKS
Usually, hyperlinks are intended to move your focus to a particular point inside the local document or some external location such as a webpage. For example, Beginning carries you to the beginning of this document, and takes you to the homepage of the SOA Technology Section.
The Policies_1 table appropriates the hyperlink for a completely different purpose. Clicking a link in the “Policy Number” column processes a policy. Clicking in the “Erase Output Data” column erases the output. These actions are initiated by
Private Sub Worksheet_FollowHyperlink (ByVal Target As Hyperlink)in the Sheet02 (Policies) module. This routine is triggered whenever we click on any hyperlink on the Policies worksheet, even if it’s a link to a website. So the Worksheet_FollowHyperlink routine uses the IsSpecialLink function to decide what to do, if anything. In particular, it
- calls gsubProcess_OnePolicy for hyperlinks in the “Policy Number” column,
- calls gsubErase_OnePolicy for hyperlinks in the “Erase Output Data” column, and
- does nothing at all for all other hyperlinks.
As shown in Figure 6, Excel displays “Click here to run just this one policy” when you glide your mouse pointer over any policy number. Similarly, it displays “Click here to erase output for this policy” when you glide over an erase link. These displays are known as screen tips. The IsSpecialLink function does its work simply by looking at the hyperlink’s screen tip, returning True or False accordingly.
Figure 6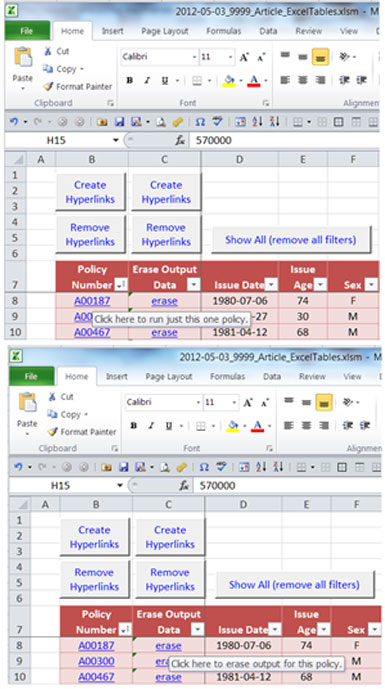
To create a hyperlink, we can right-click the cell involved and click “Hyperlink…” as in Figure 7.
Figure 7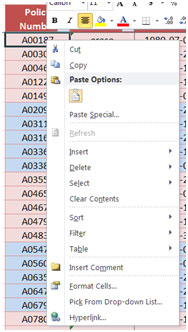
Then we set the hyperlink’s parameters as shown in Figure 8. For the first policy, they are:
Text to display: A00187 (the policy number)
Type the cell reference: B8 (pointing to itself, so we don’t jump anywhere.1)
Screen Tip text: Click here to run just this one policy
Figure 8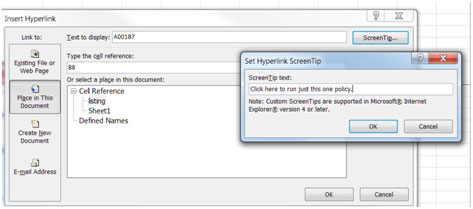
But of course, this is totally impractical if the policy count exceeds two! Therefore, above the “Policy Number” and “Erase Output Data” columns, there’s a “Create Hyperlinks” button and a “Remove Hyperlinks” button. (Try them out!) “Create Hyperlinks” invokes gsubCreateHyperlinks, which automates the above procedure. The For Each loop marches down the column, one cell at a time. “Remove Hyperlinks” runs gsubRemoveHyperlinks, which does its work with one command applied to the entire column range (no looping!).
EXCEL TABLE OBJECTS
The Microsoft Excel Object library defines “objects” for use in VBA. These include Worksheets, Ranges, and other familiar items. Three of them are of interest here.
- ListObject refers to an Excel Table.
- ListColumn is an Excel Table column.
- ListRow is an Excel Table row.
Each of these has numerous “properties” (parameters) and “methods” (associated subroutines). Just as Dim rngX As Excel.Range allows properties such as rngX.Value, so Dim oListObj As Excel.ListObject spawns oListObj.DataBodyRange.Address, etc.
CLASS MODULES
Class modules are templates for objects of our own design. Therefore, having a Class Module named pListObj allows a declaration of the following form.
Dim clsListObject As pListObj
Specifically, each of the three Class Modules is a wrapper for existing Excel objects. Thus,
- pListObj wraps around the existing Excel ListObject class. Among its members is the ListRows collection of ListRow objects (defined next), which allows looping down the table rows. Similarly, it also includes a ListColumns collection of ListColumn objects.
- pListObjRow wraps around the existing Excel ListRow class. Among its members is the Field2 property, which lets us refer to data by column name. Its Parent is a pListObj, which is defined above. The IsVisible property tests whether a row is visible (True or False), so that we can exclude filtered rows from processing.
- pListObjCol wraps around the existing Excel ListColumn class. As in the pListObjRow class, its Parent is also a pListObj.


The real benefit is the ability to refer to data by name. So if clsListRow is the table row currently under consideration, we can refer to clsListRow(“Policy Number”), clsListRow(“Sex”), clsListRow(“Smoke”), clsListRow(“Issue Age”), clsListRow(“Face Amount”), etc. It’s also possible to refer to contiguous fields as a range, as in
clsListRow(“[Premium (Base)]:[Premium (Waiver)]”).Value
MISCELLANEOUS COMMENTS
clsListRow(“Face Amount”) and its ilk work by doing an intersection of two ranges: the column defined by the field name and the row under consideration. You can do this in a conventional spreadsheet formula. Simply enter “=VerticalRangeName HorizontalRangeName” in any cell, where the two range names have been predefined so that their intersection is a single cell. That is, enter the equals sign, followed by the two range names, separated by one or more spaces. The result is the value that occupies the single-cell intersection.
In practical work, it may be better to keep the policy listing in one workbook (also containing the VBA code). A separate workbook can contain the calculation logic (the InputOutput and LookUp worksheets). Additional Basic code could load the separate workbook.
CONCLUSION
Many of these concepts are difficult to grasp initially. But as stated in the introduction, it’s not necessary to analyze all the details immediately. In fact, the mod0101_Processing and Sheet02 (Policies) modules illustrate all the techniques you really need to get some actual benefit.
GET ENDNOTES FROM ORIGINAL
Paul Margus is principal at Margus Consulting. He can be reached at paul@margusconsulting.com.