By Kevin Pledge
 A key initiative the SOA undertook a couple of years ago was to review opportunities for actuaries in analytics. The result is a hands-on seminar on Advanced Business Analytics currently in development. The computer programming language R was selected for the seminar; readers of this newsletter are no doubt familiar with Steven Craighead’s excellent R Corner articles, but is this the right language for a broader audience? There was significant debate and concern over selecting a relatively unknown language for this seminar.
A survey conducted to help plan the SOA’s analytics initiative asked the question “what software programs do you or your department use to conduct your analytical techniques?” The clear winner was Excel with 96.3 percent of the votes; this probably doesn’t mean that 3.7 percent of the respondents don’t use Excel, more likely they did not consider it to be to what they use for analytics. Behind Excel came SAS at 40.1 percent, followed by R at 7.7 percent and MATLAB at 5.9 percent. We were looking to understand the use of software that provides statistical analysis; respondents also reported other software they used for analysis of their business, including databases and pricing and valuation software. While these are clearly used as part of the analytics process, this is not what I would currently consider to be a software program for analytical techniques.
This mix of responses does not represent misunderstanding on the part of the respondents, but rather the complexity of the analytical process. There is not one single piece of software that will deliver a “platform for analytical techniques”; the systems required fall into three general categories:
- Expert Systems, such as the valuation or pricing system. These systems are the foundation of any analytical process as the business rules built into these cannot be replicated or replaced by the other components.
- Data Management System, this may be referred to as a data warehouse or business intelligence (BI) system. This should have reporting capabilities typically referred to as Online Analytical Processing (OLAP) tool, although the name is misleading as they have limited analytical abilities and are really designed to aggregate data to report pre-calculated results in various ways.
- Analytical software, such as SAS or R. This software allows users to carry out complex statistical analysis. The process typically involves building a subset of the data so that complex analysis can be carried out in memory.
Excel fits between categories 2 and 3; it can be used to manage and report results from the expert system or the Data Management System, and it can be used to some extent for statistical analysis. It is also important to note that Excel has by far the largest user base; clearly if Excel is up to the job then it is a natural choice. Also, since every company will have Excel, it can often be used to complement other tools. For example, while R produces great charts for exploratory analysis, Excel charts have a more polished look and are better for presenting to management.
However, Excel falls short when it comes to some of the more complex statistical functions and can be difficult to audit. The choice for most companies is between SAS and R. SAS, although expensive and a little outdated, is established in many companies. R is the newcomer; this free open source software is the only choice for students at many universities now.

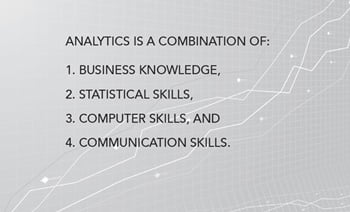
So, is this the answer to my original question, “is R the right language to teach analytics?”—not really. With a background in business intelligence, I was originally biased to the assumption that analytics is largely about computer software and database skills. This isn’t true; computer skills are part of the requirement for analytics, but they are not the most important part. In addition to computer skills, analytics requires business knowledge, statistical skills and communication skills. The lack of user-friendliness and over inflated prices of most analytical software has resulted in an over-emphasis on the computer systems. I believe a more important aspect of the new seminar will be the applied statistics.
So the real question should be whether R is suitable to support the statistical methods required for advanced business analytics. The answer is clearly yes, but other software such as SAS, MATLAB, SPSS and S Plus would also do the job. Even Excel could be used, but it is probably better to use software that is specifically analytical software (category 3 above), to better focus training on analytics rather than data management or assoc.
If anyone is interested in learning more about R, there are many free resources available online, such as courser.org, and I also recommend looking at some past articles that have appeared in the R Corner department of this newsletter. However, if you are looking to develop or sharpen your business analytics skills, you should look at the new SOA seminar when it becomes available. This will combine the other skills needed for business analytics in a live learning format, allowing the sharing of ideas.
Kevin Pledge, FIA, FSA, is CEO of Onvivo Ltd., a company that is changing the way insurance is sold. He can be contacted at kevinpledge@onvivo.com.