By Tim Heng
This is the second article in a series relating to Microsoft’s Power BI suite of tools. In case you missed the first article, check the May 2016 issue of CompAct to find out “Why You Needed To Have PowerPivot Yesterday.”
What is Power Query?
We left off the last article by suggesting that you should import data using Power Query, and use Power Pivot as your analysis tool. This gives us the first insight into what Power Query is: it’s a free Microsoft add-in for Excel 2010 and 2013 that allows you to connect to and import from a wide range of data sources. It’s just like “Get External Data,” but much better and far more powerful (which means it’s really nothing at all like “Get External Data,” I suppose). In Excel 2016, it was renamed and brought natively into Excel (no add-ins required) and falls under the Data tab, under the name “Get and Transform” (because people apparently thought that “Power” tools were too scary for general use).
At the time of writing, Power Query allows for connections to:
- Files: Excel workbooks, CSV, XML or text files;
- Databases: SQL Server, SQL Server Analysis Services, Access, Oracle, Sybase, Teradata and others;
- Azure: Microsoft Azure Marketplace, SQL database, HDInsight, Blob and Table storage; and
- Other: Web, SharePoint, OData, Microsoft Exchange, anything with an ODBC link, as well as numerous others (this list keeps growing!).
Once a connection is established, data can be cleansed and transformed. If you’ve ever done any work using SQL or Access, you should feel very familiar with some of the tools that you have at your disposal.
- Add, remove and transform columns: Easily add new columns, remove ones that you don’t need, and perform calculations to get the results that you need on a row-level basis. Adjust the data type and data formatting (important not to confuse these!), or even assign a rule to split a column into multiple parts.
- Filter and remove rows: Run rules over your datasets to remove entries that you don’t want to use. Remove invalid data or keep rows that meet your criteria. Remove duplicates or get rid of errors.
- Transform your data: Run “Group By” rules on your dataset to remove distinct rows and aggregate data. Transpose your tables—“pivot” your data values across columns—useful for taking flat-file data and creating unique columns for different parts of your dataset, just like a PivotTable. Better yet—“unpivot”columns and convert your formatted time-series data back into a flat database with a single date column so that you can create your own PivotTable analysis.
- Combine your queries: Link queries together with inner, left and right joins. Merge and append queries, or create entirely new datasets in the editor. Introduce parameters from Excel that you can use in your Power Query calculations.

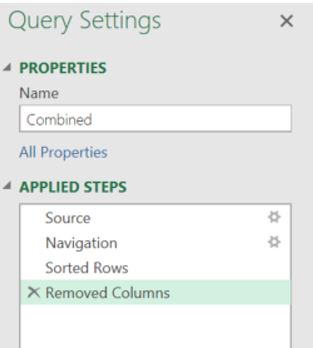
Queries are written in the M programming language, but the user interface allows for easy point-and-click steps that automatically insert the appropriate M code into the “Advanced Editor” back-end. Further useful tools come in the form of an “Applied Steps” pane on the right hand side, which provides an audit trail for each step in your process.
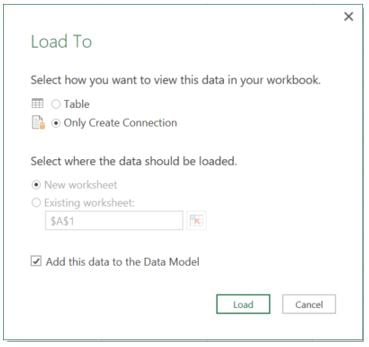
You can optionally choose to load your data directly into your Excel spreadsheet, or store the data in the data model, or both. Generally speaking, if you are using Power Query as a pass-through step, then you will only want to load it into the data model, in order to save on file size.

How can Power Query be used?
Let’s see a few examples of how Power Query can be used:
- Remember the hotel group I mentioned who used Power Pivot? They use Power Query to connect to a hotel comparison pricing website, extracting two weeks of information per webpage. Since the data comes across in blocks of hotels going down the rows, and 14 columns representing the price over a 14-day period, Power Query is used to remove intermediary header rows that are interspersed amongst actual data, then unpivoting the table so that they have a thin, long table with just the hotel name and pricing by date. This allows them to combine the resulting table (just three columns instead of 15) with five other queries representing a total of 12 weeks of data. These are imported into the Data Model in Excel to get ready for Power Pivot analysis.
- At SumProduct, we recently built a calculator for people who are playing the mobile app Pokemon Go. This calculator used crowdsourced data to estimate the “CP” multiplier that Pokemon achieved when they evolved (I appreciate that this statement may mean nothing to a few of you out there!). To get the crowdsourced data, the calculator uses Power Query to connect to a Google Document using the web connection, and cleans out the unnecessary columns. In this instance, we skipped the Power Query step and imported the data into a Table in Excel, to give us a data set that we can use in calculations that will automatically update as the Google Document is updated.
- The more conventional way to use Power Query is to connect it to an SQL or Access database, transform your dataset, and import the resulting cleansed information into the Data Model in Excel, for analysis using Power Pivot.
Considerations of when to use Power Query or Power Pivot
One of the common criticisms about doing data analysis in Excel is that the approach is generally to take as much data as possible to bring it in, on the basis that the act of importing data is time consuming and difficult. Transforming it in Excel, even using Power Pivot, then takes up memory and file size.
On the flip side, Power Query only imports the resulting cleaned dataset, rather than the all-encompassing original dataset. As a result, even if a source database is quite large, only the relevant “output” will flow into Excel, reducing the memory and file load. Likewise, calculations are done on import, and any calculations in new columns introduced will be updated on data refresh, rather than in real-time.
The question of whether to use Power Query or Power Pivot is therefore generally a question of which is more important—refresh speed, or ongoing calculation time and memory load. If you’re using Power Pivot on a 32-bit machine, it is therefore almost essential to cleanse and calculate your dataset using Power Query in order to reduce the memory that Power Pivot would use. This comes at the drawback of taking longer to update, as all the calculations will need to be done as part of the query.
Practically speaking, you will almost always want to use Power Query for as much as possible to get and transform your data (perhaps the name change was appropriate), and use Power Pivot primarily to establish the relevant relationships and perform any pivot-based analysis that you need to generate. While time-series functions in M are available, it appears that the time-series tools that DAX provides within Power Pivot are more accessible and useful for day-to-day ad-hoc work.
Where to from here?
In this and the previous article in the series, we have outlined how you can use Power Pivot and Power Query in the context of Excel. However, the next big thing is Power BI, which is threatening to take over the world with its reporting and dashboarding capabilities. Although Power BI is distinct from Excel, Power Query and Power Pivot are essential building blocks in using Power BI, so stay tuned for the final article in our series in the next newsletter!
Tim Heng is a director at SumProduct, specializing in Excel modeling and training services. He can be contacted at tim.heng@sumproduct.com.
