Small Group Rate Comparison: ACA versus Multiple Employer Welfare Arrangement (MEWA) Plans
By William Ju
Health Watch, September 2025

The year 2014 marked a new beginning for the small group (SG) health insurance market, which ushered in adjusted community rated products priced from a single risk pool. It was anticipated that the mandated risk pooling would result in higher rates, especially for healthier groups. It is the aim of this article to show whether that view bears out in the current actual market rates and, if it is higher, by how much. The article provides a point in time (first quarter 2025) comparison of premium rates under two segments of the small group market, namely qualified health plans (QHPs) available under the small group Affordable Care Act (ACA) market and self-insured multiple employer welfare arrangements (MEWA) plans.
The MEWA Plan
MEWA is one of the non-ACA-compliant options available that predates the ACA. Often, a MEWA comprises self-insurance for a group of employers in the same industry, trade or profession formed for purposes other than obtaining or providing insurance. On the surface, it is very much like the small group fully insured plans that existed prior to the ACA:
- The plan has a trust fund set up by a sponsor (such as a professional association) to provide participating employers and their respective employees and their dependents with medical, health and welfare benefits operating on a nonprofit basis.
- It contracts with a third-party administrator (TPA; usually an insurance company) and pharmacy benefit manager (PBM) for administrative services and network access.
- Adjusted community rating methodology is used to determine premium-equivalent rates based on prior experience of the entire block, if credible.
- The allowed rating variables include age, gender, number of family members covered, geographic area, industry and claims experience, but the selection of parameters varies by MEWA (for example, many do not use area and industry as rating variables).
- Underwriting adjustments are made based on claims experience and health status, with rates up to 25% below the index rate for healthier groups. Underwriting rules are used to place a group in a risk category based on claims experience and assigned credibility. Incremental changes in the placement of risk categories are the norm.
There are some key differences between MEWAs and small group fully insured plans as well:
- MEWA coverage is not an insurance contract. Therefore, the trust fund is not subject to any insurance guaranty association protection. Participating employers are responsible for funding all claims incurred by members covered under the trust (necessitating assessment of the employers to protect coverage from cases of insolvency).
- Therefore, specific stop-loss and aggregate stop-loss reinsurances are used to cover the risk of catastrophic claims. Guidance is provided to determine the appropriate level of the attachment point based on the projected annual claims amount and the surplus level.
- MEWAs are subject to state regulations specific to this type of plan.
- MEWAs provide nonbenefit expenses savings as no profit margin is used in the rates.
- Favorable claims experience provides lower rates, but unlike level-funded plans, there is no refund of the premium-equivalent contributions for the group from its favorable claims experience.
The MEWA is largely used by small employer groups as a vehicle to provide self-insurance for the members’ employees and their dependents, with the aim of taking advantage of favorable claims experience and no profit charges.
Other types of small group medical coverage exist on the market today, such as grandfathered and transitional SG plan blocks (these are closed for new sale), which are fully insured plans and relatively nascent level-funded products that are poised to increase in popularity (proposed federal and state rules promote the growth of level-funded products by allowing reinsurance access to smaller employer groups), but they are not considered for this article.
Data Underlying the Analysis
The premium rates of the ACA SG plans underlying the study are based on filed and approved rates in a small group market for the benefit year 2025. Rates from six issuers with 2,407,038 projected member months were reviewed for the rate comparison.
The premium-equivalent rates for the MEWA association plans are based on filed and approved rates of two leading MEWA entities by size in the same region where the ACA SG plans marketed with 56,712 projected member months in the current year.
Tables 1 through 5 show the comparison summaries. The member months shown are projected member months for 2025 for the ACA block; the member months shown for the MEWA block are based on July 2024 and February 2025 census data for the two MEWA plans, respectively. The rate in each age/metal tier cell represents the average rate of all plans that falls within the metal AV range. The MEWA rates represent the composite risk level of the groups included in each cell. The benefit differences between the two segments, such as pediatric dental covered under the ACA plans and the out-of-network coverage under the MEWA plans, are not reflected in the rate comparison and are considered to have only a minor impact on the comparison.
Two issuers have products in more than one network. The ACA SG rates used in the comparison are composite rates of the multiple networks for the two issuers.
Table 1 shows ACA small group premium rates; Table 2 shows MEWA small group premium-equivalent rates. The rates on Tables 1 and 2 represent first quarter 2025 effective date rates.
In all tables, PMPM = per member per month, and AV = actuarial value.
Table 1
ACA Small Group Premium PMPM Rate at the Selected Ages
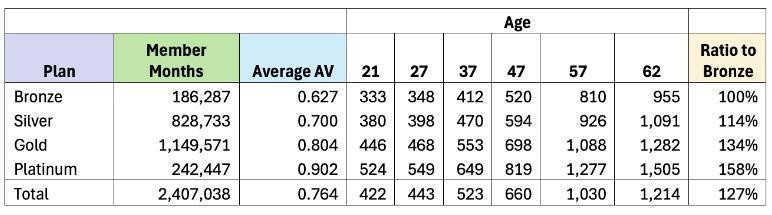
Table 2
MEWA Small Group Premium-Equivalent PMPM Rate at the Selected Ages
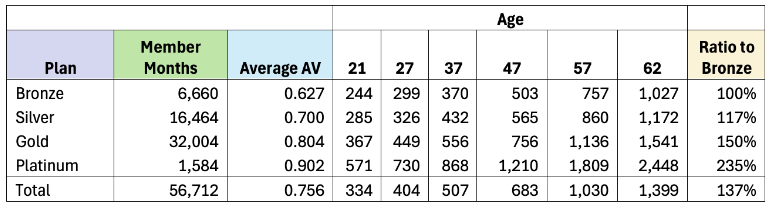
Table 3
ACA Rates Compared to MEWA Rates
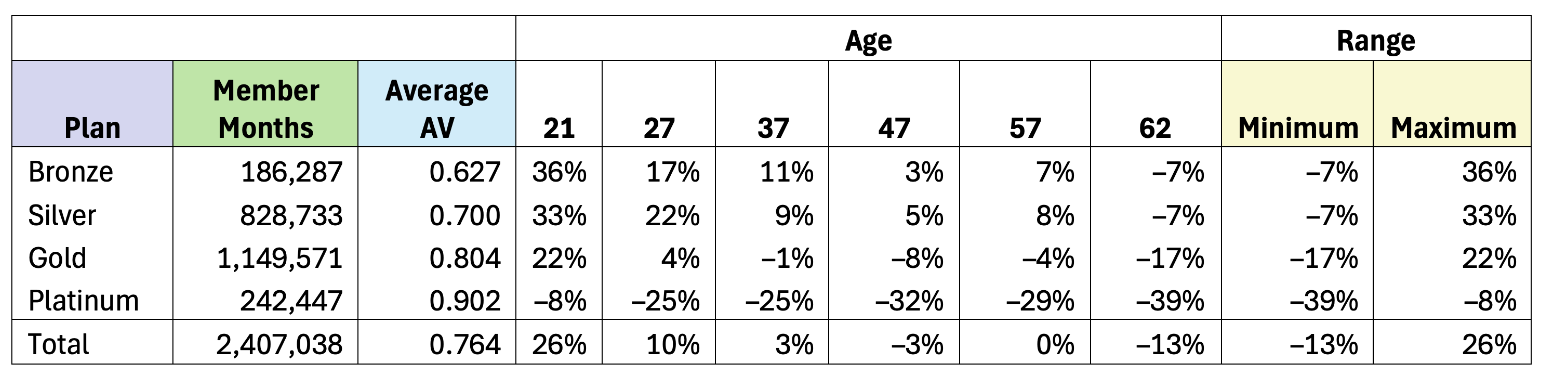
Table 4
ACA Rates Compared to ACA Age 21 Rates
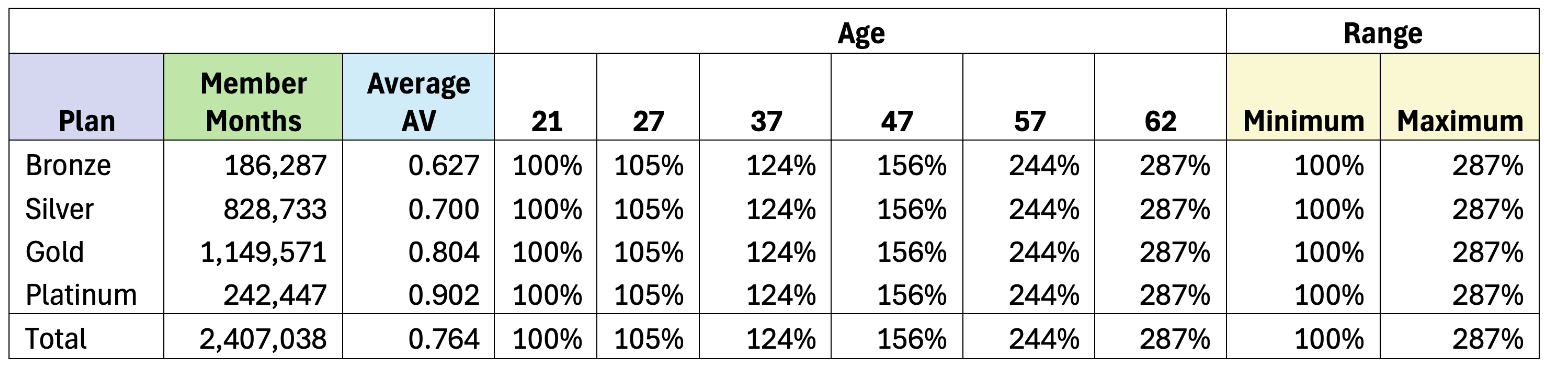
Table 5
MEWA Rates Compared to MEWA Age 21 Rates
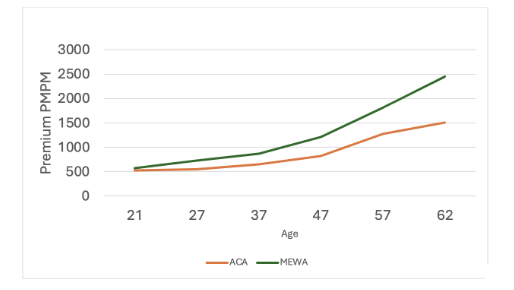
Figures 1 through 4 the rate comparison by metal plan.
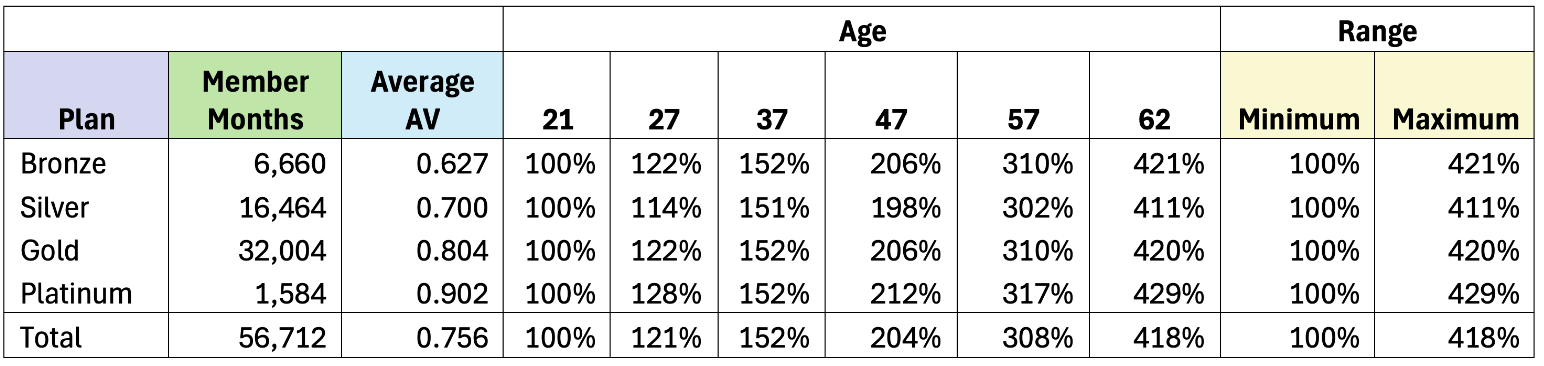
Figure 1
Bronze Rate Comparison
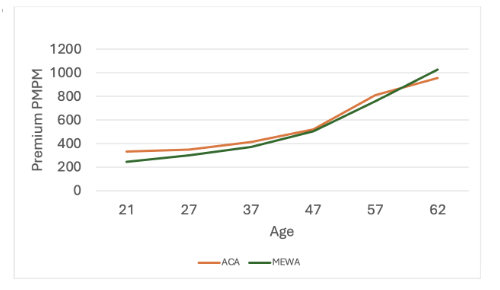
Figure 2
Silver Rate Comparison
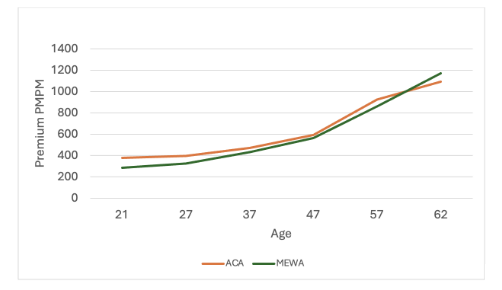
Figure 3
Gold Rate Comparison
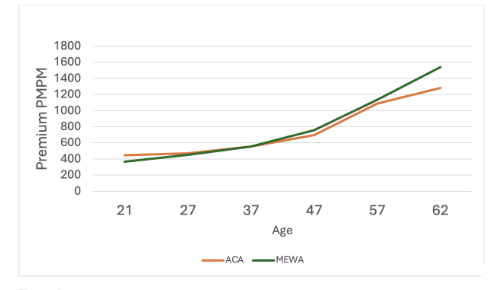
Figure 4
Platinum Rate Comparison
Observations
As shown in Table 3 and the figures, the ACA rates are higher for younger subscribers and lower for older subscribers. This reflects a wider age factor range allowed for adults under the MEWA plans compared to the 3 to 1 compressed age factor range for adults imposed on the ACA plans. ACA rates are as much as 36% higher for bronze plans at age 21 than the comparable MEWA plan rates but can be 39% lower for platinum plans at age 62. The comparison shows the MEWA rates are favorably priced for younger ages (leaner plans) and uncompetitively priced for older ages (richer plans).
The last column in Tables 1 and 2 show the metal plan rate relativities to the bronze plan. The ratios for the silver plan are relatively close—114% for ACA versus 117% for MEWA. The benefit relativity ratios rise much more for the gold and platinum plans for the MEWA block, showing 235% for the MEWA platinum compared to 158% for the ACA platinum plan.
Tables 4 and 5 show rate ratios compared to the age 21 rates for each block. As expected, the age ratios are the same for each age in all the metal plans for the ACA block. The age ratios for the ACA block (Table 4) match the age factors prescribed by the ACA rating rules. The rate ratios at each age differ by metal plan (Table 5, MEWA block) to reflect the different membership weights used for each metal plan. The age ratios are much steeper for the MEWA block, ranging from 411% to 429% at age 62.
Adjustments Made for Comparison
To have an apple-to-apple comparison of rates between the two segments, the following adjustments were made to the rates:
- Normalized for plan benefit relativity differences
- The MEWA plans were grouped into four metal tiers—bronze, silver, gold, and platinum—based on the AV values calculated using the federal AV calculator.
- The MEWA metal tier rates were adjusted to reflect the average AV value differences between the two segments.
- Six age groups selected for comparison by age
- MEWA plan rates with gender-distinct pricing were combined to reflect unisex pricing.
- Ages 21, 27, 37, 47, 57 and 62 were selected to cover a broad age range.
- Area distribution differences
- The MEWA rates are not rated by region. Therefore, adjustment is made on the ACA rates of each issuer to reflect the area distribution of the two MEWA subscribers.
- The MEWA subscribers were grouped into the area regions used by the ACA plans based on their zip-codes.
- The area distribution of the MEWA subscribers was then applied to the area factors of each issuer to calculate the average area factor applied to the rates of each issuer respectively.
- The resulting ACA rates of each issuer reflect the area distribution of the combined MEWA census.
Conclusion
If asked whether the single risk pool ACA rate is higher, the answer seems to be “It depends.” It depends on the age group and the level of benefits sought. You are better off with ACA plans if you are old and looking for plans with richer benefits. A MEWA plan would be a better choice if you are younger and fine with leaner benefits. Even though these observations are based on a comparison of data from one small group market, we would expect similar rate relationships—with somewhat varying degrees—between the two segments in other SG markets as well.
The ACA rates are substantially higher at younger ages, likely due to the compressed age factor range prescribed, where the oldest to youngest adult age factor ratio is 3 to 1. The MEWA plans are allowed to use a broader age factor range, resulting in relatively lower rates for younger ages. The higher MEWA rates shown in richer benefit plans with older age groups likely reflects conservative pricing to mitigate the anti-selection risk anticipated for such coverage.
Each market segment offers advantages and disadvantages. The ACA market provides fully insured plans that are well regulated. Large carriers usually compete in these settled markets, providing many plan choices to consumers. Self-insured MEWA plans have a cost advantage through lower nonbenefit cost (3% to 4% of the premium) compared to that of ACA plans, as no profit margin is included in their rates. Additional rate savings can be available for healthier groups through underwriting discounts, which may be substantial. However, MEWA plans incur additional reinsurance expenses that are not found in the ACA plans. The former are less stable due to the small membership size and therefore lack economy of scale. And because a MEWA is not an insurance contract, it invokes closer regulatory oversight.
This article is provided for informational and educational purposes only. Neither the Society of Actuaries nor the respective authors’ employers make any endorsement, representation or guarantee with regard to any content, and disclaim any liability in connection with the use or misuse of any information provided herein. This article should not be construed as professional or financial advice. Statements of fact and opinions expressed herein are those of the individual authors and are not necessarily those of the Society of Actuaries or the respective authors’ employers.
William Ju, ASA, MAAA, is a Life & Health actuary at North Carolina Department of Insurance. William can be reached at William.ju@ncdoi.gov.