Heatmaps and the Development of Cancer Incidences
By Irene Schepp
Reinsurance News, September 2025

Cancer is a common cause of claims in life and health insurance. Screening methods and medical progress have influenced detection and treatment, affecting morbidity and mortality rates. As actuaries we need to understand the developments in the past to make reliable assumptions for the future. Depicting changes over time in the form of heatmaps is a technique that can support the work of actuaries.
Heatmap, Surface and Contour Chart
A heatmap is a visualization technique used for representing large datasets, where values are illustrated through a predefined range of colors. A heatmap is often a 2-dimensional picture but also a 3-dimensional analysis is possible based on e.g., surface charts, where colors and patterns indicate areas that are in the same range of values as in a topographic map.
All heatmaps included in this article were prepared on the basis of U.S. cancer data of CI5plus.[1] This article comments on key changes in cancer incidence rates—particularly among young adults. When cancer is diagnosed in people aged 18 to 49 years it is typically called “early-onset” cancer. Over the past decades, the incidence of early-onset cancers has increased in multiple countries and in many sites (e.g., breast and colorectum). While most of these cancers appear sporadic (i.e., not caused by inherited genetic mutations or family history) the reasons for the increase in incidences are currently unclear and under investigation. While improved detection through extended use of screening programs may play a role, evidence indicates a real rise in early-onset cases.[2]
We used a model in R to smooth raw cancer incidences by calendar year and age group. The data was then transferred to Microsoft Excel, where we used a contour chart (i.e., a surface chart viewed from above, similar to 2-D topographic maps). In a contour chart, color bands represent specific ranges of values. The lines in a contour chart connect interpolated points of equal value.[3] We then utilized a color concept (inspired by traffic lights) to visualize the data.
Breast Cancer
Female breast cancer is the most common cancer in many countries. In the U.S. in 2025, there will be an estimated 316,950 new cases of invasive breast cancer diagnosed in women.[4] Screening initiatives have been introduced in the past and the incidence rates are developing differently by age group and period as shown in Figures 1A and 1B.
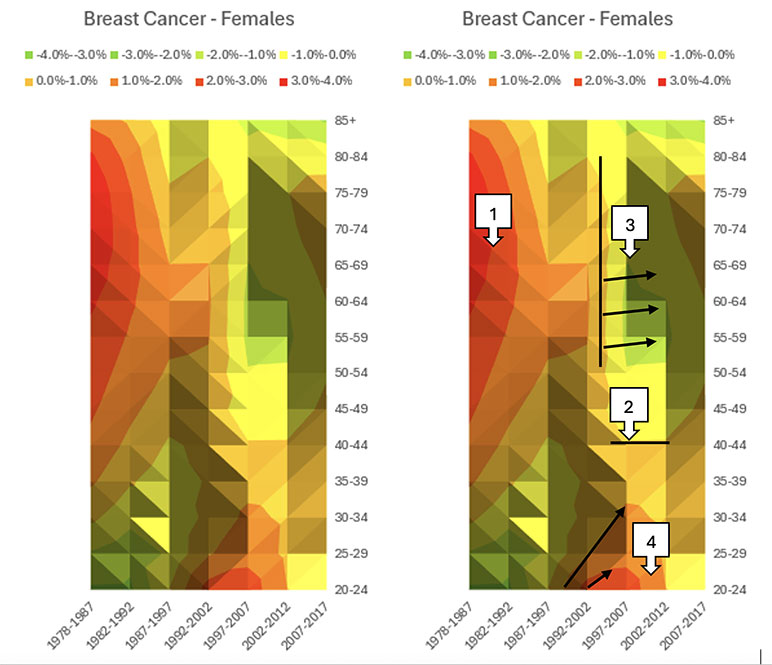
Figures 1A and 1B
Changes of Breast Cancer Incidence per Age Groups (1978-2017), 10 Years Rolling, Females, ICD-10 code C50, Contour Chart Visualization without Markers (A) and with Markers (B).
Screening
Screening initiatives, done via mammograms (low-dose x-rays), focus on identifying early stages of cancers or even precursors of cancer thus affecting incidence rates.
The first mammography trial was conducted in the U.S. in 1963 to explore the efficacy of screening. Women aged 40 to 64 years participated in the trial. The results were convincing in women with higher ages, however, the screening of women in their 40s was seen as questionable.[5]
It took until 1976 for the American Cancer Society (ACS) to officially recommend yearly mammogram screening for women at average risk aged 50 and over. In the years following the screening introduction, a notable increase in the cancer incidence for the affected age groups, where more cancers were detected, was observed (see Figure 1B, Marker no. 1).
Starting in 1983, the ACS included younger women (age 40 to 49) in the regular mammogram screening program and recommended screening every one to two years. Starting in 1997, annual screening was advised—a change that is slightly indicated by Marker no. 2.[6] Awareness of the disease received another boost in the 1990s with the adoption of the pink ribbon symbol and the growth of the Susan G. Komen foundation.[7] Implementing a screening program can be valuable; however, it is equally important to raise awareness and encourage active participation among individuals.
We saw the success of the screening program in the decline of incidence rates in women aged 50 and above in the following years (see Marker no. 3). Since 2015, the ACS has recommended annual mammogram screening for women aged 45 to 54. Women aged 40 to 44 and those 55 and older can choose annual screenings. The older age group is advised to follow a biennial schedule. Screening mammograms should continue as long as a woman is in good health and is expected to live at least 10 more years.[8] Future data will show the effectiveness of the updated recommendations.
Early-onset Breast Cancer
In Figure 1B (see Marker no. 4), we see a negative development of higher cancer incidences for women below age 45. Especially the youngest age groups seem to be strongly affected in periods starting in 1992 followed by less high (but still positive) increases of incidences in the next periods, until 2012. The data indicates that the number of cases within this age group is low, with approximately 15 cases per year recorded between 1992 and 2017. Prior to utilizing these heatmap results for groups at the margins of the age range, they should be thoroughly examined to assess the impact of volatility (and smoothing).
In 2025 the ACS reported that invasive female breast cancer incidence has been increasing since the mid-2000s. From 2012 to 2021, the rate increased by 1% per year overall; 1.4% per year in women younger than 50 years; and by 0.7% per year in those aged 50 and older.[9]
Conclusion on Breast Cancer
Heatmaps can highlight the periods and age groups that show the strongest developments over time. Breast cancer incidence rates seemed to be mostly affected by the introduction of screening initiatives in the past for women above age 50, followed by improvement over time. The development of incidence rates in women below age 50 should be closely monitored and further analyzed until the main risk factors of breast cancer are better understood.
We will see how innovations in detection, e.g., 3D mammography exams or liquid biopsy, which provide a greater accuracy, could change how and at which patient’s age and stage we detect breast cancer in the future.
Colorectal Cancer
Colorectal Cancer (CRC) refers to bowel, colon and rectal cancer. Like breast cancer, CRC is one of the most common types of cancer worldwide. It is a cancer type where a lot of concern has been raised about early-onset cancer in the last years. Let us see how the visualizations of changes in cancer incidences look like—differentiated by gender (see Figures 2A and 2B).
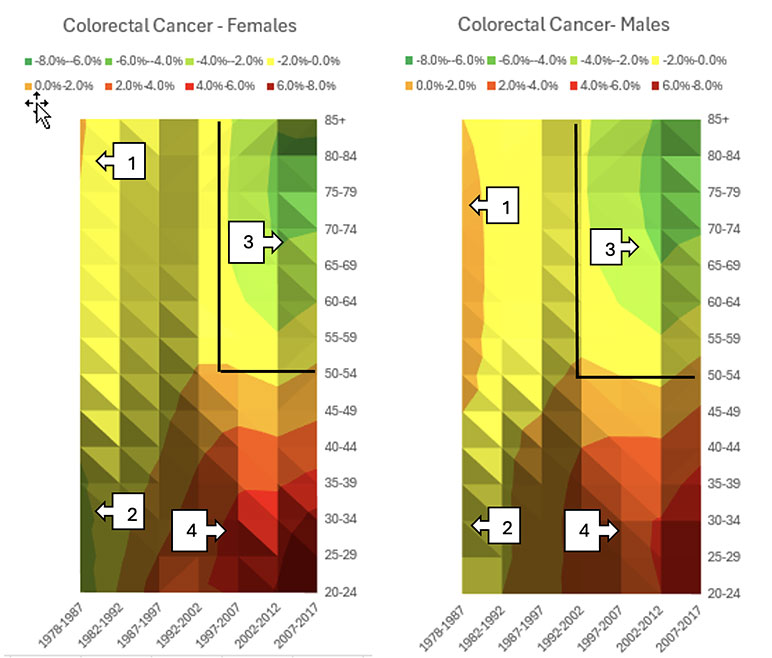
Figures 2A and 2B
Changes of Colorectal Cancer Incidence per Age Groups (1978-2017), 10 Years Rolling, ICD-10 code C18-20, Contour Chart Visualization for Females (A) and Males (B).
The changes in CRC incidence rates over time by gender appear to follow similar patterns, occasionally with variations in timing or intensity between genders.
Screening
Figures 2A and 2B (see Markers no. 1) indicate that prior to the commencement of screening initiatives in the U.S., young female adults showed higher improvements in incidence rates compared to male adults. This trend was also observed in females aged 45 and over (see Markers no. 2) during the period from 1978 to 1987.
In the mid-1990s, the first screening recommendations were introduced in the U.S. Adults aged 50 and over were recommended to have a regular CRC screening via colonoscopy.[10] Usually, participants can choose from various methods for CRC screening tests, such as stool-based tests (e.g., fecal immunochemical tests (FIT) or stool DNA tests) or visual examinations (e.g., flexible sigmoidoscopy alone or with FIT, computed tomography colonography, or colonoscopy). If participants choose to be screened with a test other than colonoscopy, any abnormal test result should be followed up with a timely colonoscopy. The heatmap did not reveal an increase in CRC incidence since the mid-1990s. This may be attributed to relatively low screening rates, approximately 42%.[11]
Since 2018 the ACS recommends that people at average risk of colorectal cancer start regular screenings at age 45. People at higher risk might need to start earlier.[12]
As we can see (from Markers no. 3) the screening initiative appears to have a positive effect on incidence rates for females and males in higher ages. Screening for colorectal cancer not only detects existing cases in participants who have no symptoms of the disease but also contributes to a long-term reduction in incidence rates.
This outcome is attributable to the ability of screening tests to find polyps (i.e., growth on the inner lining of the colon or rectum). Polyps are quite common, especially with advancing age. Most polyps are benign, but some types of polyps can change into cancer. Typically, they require 10 to 15 years to progress into malignant forms.[13] Colonoscopies enable physicians to remove polyps before they become cancerous, thereby preventing the onset of the disease.
Heatmaps can highlight the periods and age groups of notable shifts in incidence rates. Since the early 1980s, the data shows a significant increase in cancer incidences among younger adults in the U.S. (see Markers no. 4) which is steadily worsening over time, particularly among women. Although incidence rates for younger adults are on a lower level compared to older adults, in general, these trends are concerning.
Conclusion on Colorectal Cancer
Mortality trends for CRC are significantly worse than those for breast cancer. Both incidence and mortality are increasing among younger adults aged below 40. As a result, CRC has recently become the main cause of cancer-related death among males aged 20 to 49 years in the U.S., and current estimates indicate that by 2030 one-third of all CRC will be diagnosed in individuals younger than 50.[14]
Within the scientific community there are studies and discussions on the influences of various risk factors leading to a higher number of CRC diseases. What are the changes compared to the mid-1980s? Are the younger generations more exposed to some environmental factors? How did their diet change? Is the CRC progression different in younger adults and changing over time? The wide range of topics and the possible interactions between the risk factors present scientists with a complex field of work.
Summary
Heatmaps are an effective tool for visualizing changes over time in large datasets. They can show the impact of screening measures, particularly when targeting specific age groups, and reveal characteristics of individual cohorts. Additionally, future modifications to screening programs are anticipated to influence changes in incidence rates. Consequently, historical trends may not serve as reliable predictors for future trends.
This article is provided for informational and educational purposes only. Neither the Society of Actuaries nor the respective authors’ employers make any endorsement, representation or guarantee with regard to any content, and disclaim any liability in connection with the use or misuse of any information provided herein. This article should not be construed as professional or financial advice. Statements of fact and opinions expressed herein are those of the individual authors and are not necessarily those of the Society of Actuaries or the respective authors’ employers.
Irene Schepp is a senior actuary, working in the Global Underwriting and R&D | Products & Analytics department for Gen Re. Irene can be contacted at Irene.Schepp@genre.com.
Endnotes
[1] Ferlay J, Colombet M and Bray F. Cancer Incidences in Five Continents, CI5plus: IARC CancerBase No. 9 [Internet]. Lyon: International Agency for Research on Cancer. Available from: https://ci5.iarc.fr/ci5plus/download, USA, SEER (9 registries), accessed April 1, 2025.
[2] Ugai, T., Sasamoto, N., Lee, HY. et al. Is early-onset cancer an emerging global epidemic? Current evidence and future implications. Nat Rev Clin Oncol 19, 656–673 (2022). https://doi.org/10.1038/s41571-022-00672-8, accessed May 21, 2025.
[3] Available chart types in Office, Types of surface charts – Contour, https://support.microsoft.com/en-us/office/available-chart-types-in-office-a6187218-807e-4103-9e0a-27cdb19afb90, accessed May 22, 2025.
[4] American Cancer Society, Cancer Facts & Figures 2025, Page 5, https://www.cancer.org/content/dam/cancer-org/research/cancer-facts-and-statistics/annual-cancer-facts-and-figures/2025/2025-cancer-facts-and-figures-acs.pdf, accessed May 21, 2025.
[5] Shapiro S. Periodic screening for breast cancer: the Hip Randomized Controlled Trial. Health Insurance Plan J Natl Cancer Inst Monogr. 1997;1997(22):27–30. doi: 10.1093/jncimono/1997.22.27.
[6] American Cancer Society, History of ACS Recommendations for the Early Detection of Cancer in People Without Symptoms, https://www.cancer.org/health-care-professionals/american-cancer-society-prevention-early-detection-guidelines/overview/chronological-history-of-acs-recommendations.html, accessed May 21, 2025.
[7] Accardi T. Mammography Matters: Screening for Breast Cancer – Then and Now, Radiology Today, Vol. 18 No. 5 P. 7, https://www.radiologytoday.net/archive/rt0517p7.shtml#:~:text=Although%20the%20concept%20of%20mammography,Society%20to%20officially%20recommend%20it, accessed 21st May 2025.
[8] American Cancer Society, History of ACS Recommendations for the Early Detection of Cancer in People Without Symptoms, https://www.cancer.org/health-care-professionals/american-cancer-society-prevention-early-detection-guidelines/overview/chronological-history-of-acs-recommendations.html, accessed May 21, 2025.
[9] American Cancer Society, Cancer Facts & Figures 2025, Page 5, https://www.cancer.org/content/dam/cancer-org/research/cancer-facts-and-statistics/annual-cancer-facts-and-figures/2025/2025-cancer-facts-and-figures-acs.pdf, accessed May 21, 2025.
[10] Gastroenterology, The Colonoscopy: A Historical Timeline, https://gastrohealthpartners.com/the-colonoscopy-a-historical-timeline/, accessed May 21, 2025.
[11]Doubeni CA. The impact of colorectal cancer screening on the US population: is it time to celebrate? Cancer. 2014 Sep 15;120(18):2810-3. doi: 10.1002/cncr.28789. Epub 2014 Jun 3. PMID: 24895320; PMCID: PMC4378239. Figure “Colorectal Cancer Test Use Rates for Adults 50 years and older by Race/Ethnicity: NHIS 1987-2010”, https://pmc.ncbi.nlm.nih.gov/articles/PMC4378239/#F1, accessed May 21, 2025.
[12] ACS, Colorectal Cancer Early Detection, Diagnosis, and Staging, https://www.cancer.org/cancer/types/colon-rectal-cancer/detection-diagnosis-staging.html, accessed May 21, 2025.
[13] ACS, Can Colorectal Polyps and Cancer Be Found Early? https://www.cancer.org/cancer/types/colon-rectal-cancer/detection-diagnosis-staging/detection.html, accessed May 21, 2025.
[14] G. Mauri et al., Early-onset cancers: Biological bases and clinical implications, Cell Reports Medicine, Volume 5, Issue 9, 2024, 101737, ISSN 2666-3791, https://doi.org/10.1016/j.xcrm.2024.101737.
https://www.sciencedirect.com/science/article/pii/S2666379124004671, accessed May 21, 2025.