US Population Mortality Observations - Updated with 2018 Experience
Table of Contents
Summary
Podcast
Materials
Data Visualizations
Summary
February 2020
This report covers the latest emerging trends in U.S. population mortality. The SOA relied upon data furnished by the Centers for Disease Control and Prevention (CDC). Observations are based on the CDC’s recent release of 2018 mortality experience, along with prior mortality experience data from 1999 through 2017.
The report is found in a pdf below and contains key observations from this analysis. Three interactive dashboards have also been provided for the user to explore the results. Scroll down on this webpage to find these dashboards. The report pdf contains all the assumptions and definitions used to create the graphs and tables contained in the dashboards. Finally, the appendices referenced in the report pdf are contained in an Excel file below.
Suggested citation: Holman, R. J., C. S. MacDonald, and P. J. Miller. U.S. Population Mortality Observations-Updated with 2018 Experience. Society of Actuaries, March 2020.
Podcast
Research Insights – US Population Mortality Observations - Updated with 2018 Experience
Materials
US Population Mortality Observations – Updated with 2018 Experience
US Population Mortality Observations – Appendices
Data Visualizations
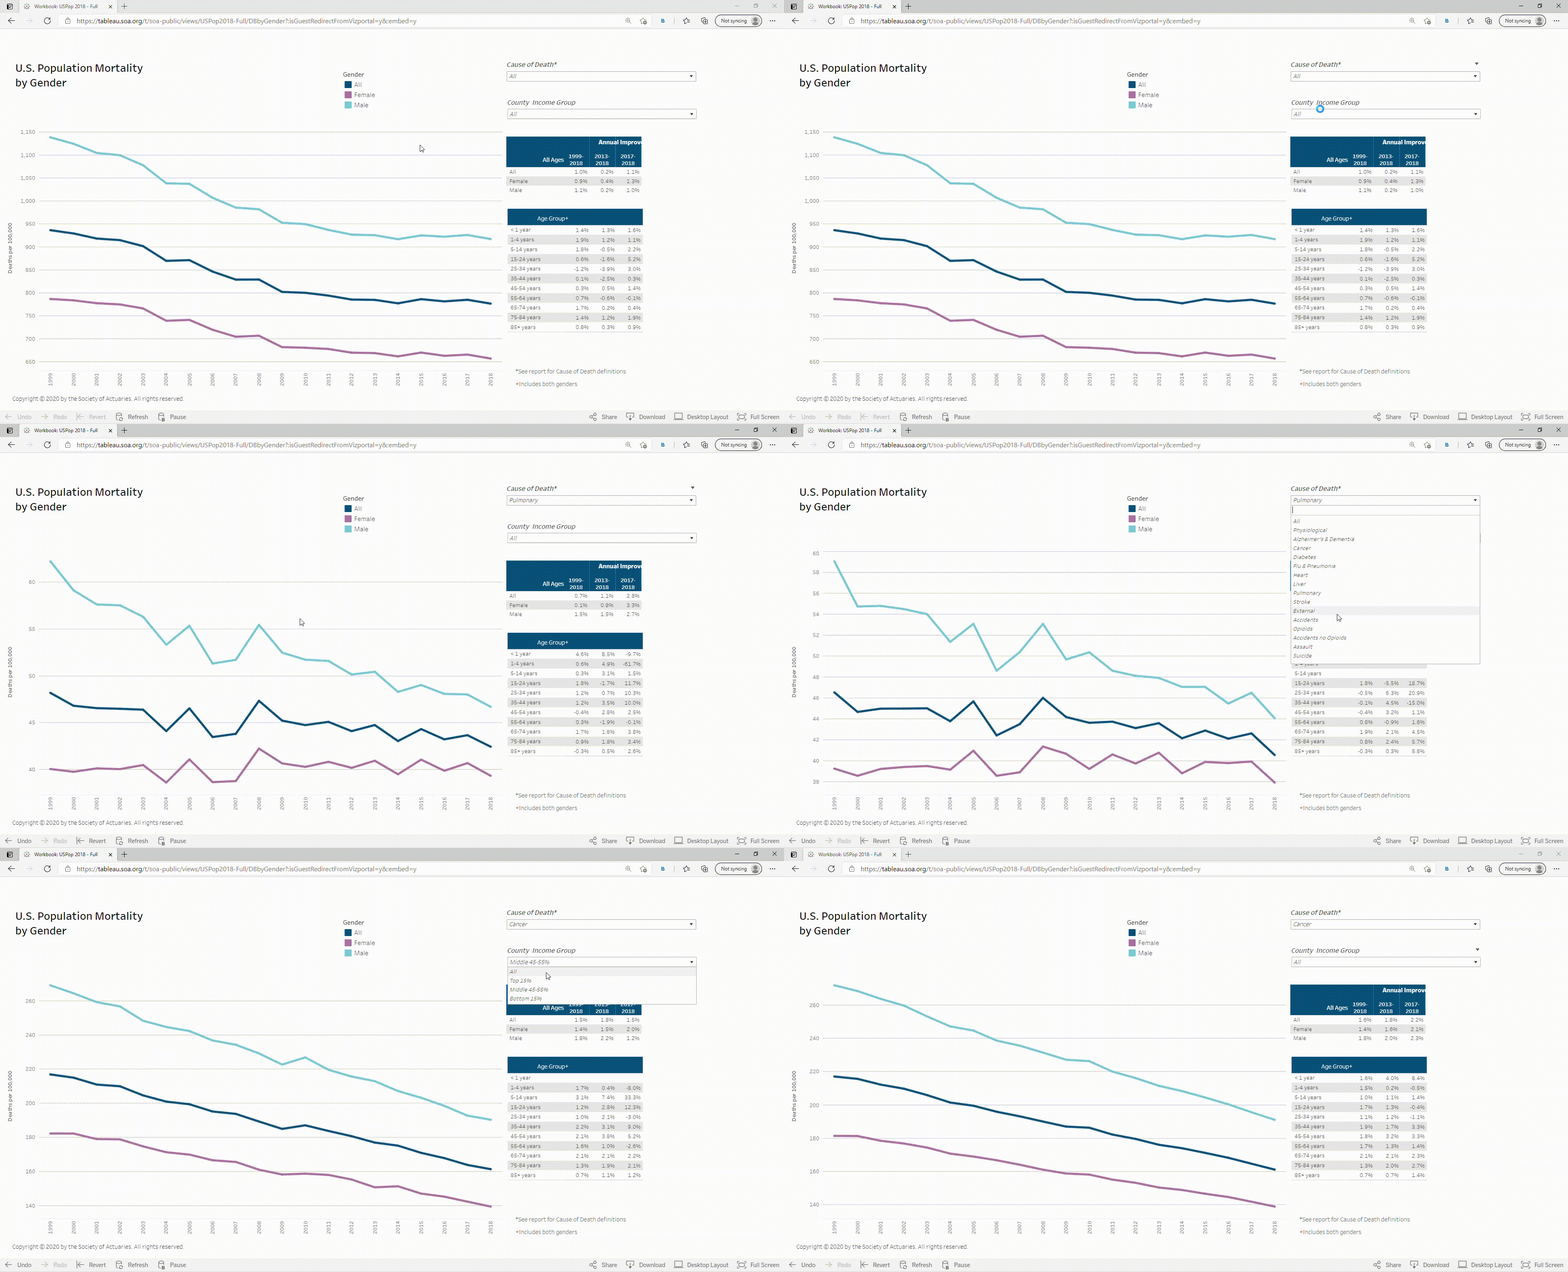
These interactive dashboards are visualizations of key metrics found in the report. They provide filtering, drill-down, and other interactive capabilities that allow you to focus on specific subsets of the data.

U.S. Population Mortality by Gender
U.S. Population Mortality by County Income Group
U.S. Population Mortality by Opioid Type and County Income Group
Questions Or Comments
Give us your feedback! Take a short survey on this report. Take Survey
If you have comments or questions, please email research@soa.org.
