Navigate through Risk-Based Capital with Success
By Jinjun (Sophia) Yu and Karena Weikel
Health Watch, December 2021

According to the seventh edition of Group Insurance, risk-based capital (RBC) is “a method of measuring the minimum amount of capital appropriate for an insurer to support its overall business operations, taking into consideration the insurer’s size and risk profile.”[1]
Regulators use RBC to assess the amount of capital being held in relation to the amount of risk the company is taking. In general, the higher the risk, the higher the amount of capital that needs to be held. The RBC requirement specifies a minimum amount to be held by the company and does not mean that is the full amount an insurer should hold. RBC is part of a framework that provides regulators with legal authority to take control of the insurer if the insurer’s RBC falls below regulatory levels. These levels provide a statutory requirement to protect the policyholder against insurer insolvency.
The following overview of the Health RBC formula discusses regulatory action levels, key components and strategies, and ends with a clarifying case study. If you would like further information regarding this topic, please refer to the Group Insurance textbook and the websites of the American Academy of Actuaries (AAA) and the National Association of Insurance Commissioners (NAIC). The NAIC adopted RBC formulas for health, life and property/casualty; it annually publishes/updates “Risk-Based Capital Forecasting and Instructions” in each of these three areas. This article discusses only the health statutory (often referred to as “orange blank”) filing and the Health RBC formula.
The Health RBC after covariance (RBCAC) formula is as follows:
RBCAC = 1.03 * (H0 + [H12 + H22 + H32 + H42]½)
where
- H0 = asset risk for affiliates;
- H1 = asset risk for other affiliates;
- H2 = underwriting risk;
- H3 = credit risk; and
- H4 = business risk.
Please note that the 3 percent operational risk add-on can be reduced by the C-4a component of any blue blank subsidiary. It is relatively uncommon for an orange blank company to have a blue blank subsidiary.
Regulatory Actions
Different levels of capital allow or require different actions and are referred to as “action levels.” The action level depends on the ratio of actual capital to the required capital for an insurer based on the RBC formula specified by the NAIC. The actual capital, also known as the total adjusted capital (TAC), is compared to the company’s authorized control level (ACL) capital requirement. It is essentially the insurer’s statutory capital and surplus, plus any other adjustments per risk-based capital requirements, such as affiliates’ asset value reserve. ACL is 0.5 times the Health RBCAC. Regulatory consequences follow the process shown in Table 1 based on the TAC-to-ACL Ratio.
Table 1
Process for Regulatory Consequences
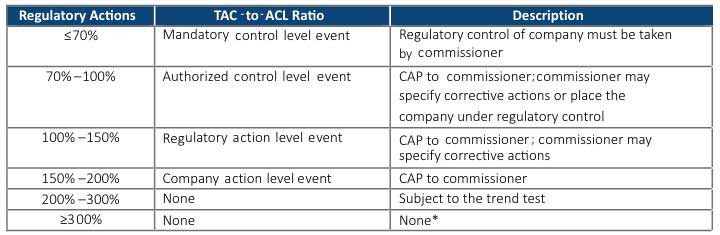
Source: Bell, Rowan B., Robert B. Cumming and Constance Peterson. 2020. Risk-Based Capital Formulas. In Group Insurance, 679. 7th ed. Edited by Daniel D. Swire et al. New Hartford, CT: ACTEX.
CAP = corrective action plan.
*Some states adopt exceptions to the standard provisions described in this table.
Health RBC is a standardized way to aggregate risk using a capital formula applied across insurers and for the public record. Some rating agencies require insurers to maintain a certain TAC-to-ACL ratio. The Blue Cross and Blue Shield Association also requires member insurers to maintain a certain ratio to retain the use of the association’s trademark.
Key Components of Health RBC
The underwriting risk (H2) is by far the most dominant category for health insurers. This article highlights how different insurers’ strategies impact this risk and the effects on the RBC formula output. For a health insurer setting, premium rates to cover future cost of insurance is the riskiest part of the business, which encompasses underwriting risk. Health actuaries and underwriters are responsible for the premium rates offered for their company’s products. Here are some examples:
- Medicare Advantage—actuaries submit a bid each year for the premiums required to cover future expenses.
- Commercial exchange—actuaries submit an annual rate filing for their products’ future expenses.
- Commercial non-exchange employer group business—underwriters review and rate each group based on the group’s future risk profile with pricing models, actuarial factors and judgment for any plan, network and demographic changes.
Underwriting risk has two components: (1) claim experience fluctuation risk and (2) other underwriting risk, which is immaterial to most companies. According to the NAIC model, the claim experience fluctuation has five product groupings:
- Comprehensive Medical and Hospital
- Medicare Supplement
- Dental and Vision
- Medicare Part D–only plans
- Other (non-Medicare standalone drug products; others that don’t fit into the other four categories)
Comprehensive Medical and Hospital covers the majority of health insurer business, since it covers almost all group and individual medical products. This product grouping includes commercial, Medicaid managed care and Medicare Advantage products, but it does not include the Federal Employees Health Benefits Program, TRICARE or administrative service–only coverages. Table 2 is used to determine the underwriting risk factor, applied to incurred claims, by the five product groupings. Each grouping is assigned a different underwriting risk factor.
Table 2
Underwriting Risk Factors (in Millions)

Source: RBC Report, page XR012.
For example, using this table, if an insurer has $500 million of premium in the Comprehensive Medical and Hospital grouping, the weighted average risk factor would be 9.3% (15% * $25M/$500M + 9% * $475M/$500M). The differences in the percentages are relative to the amount of risk and volatility of experience. Also, changes in claim levels drive changes in ACL.
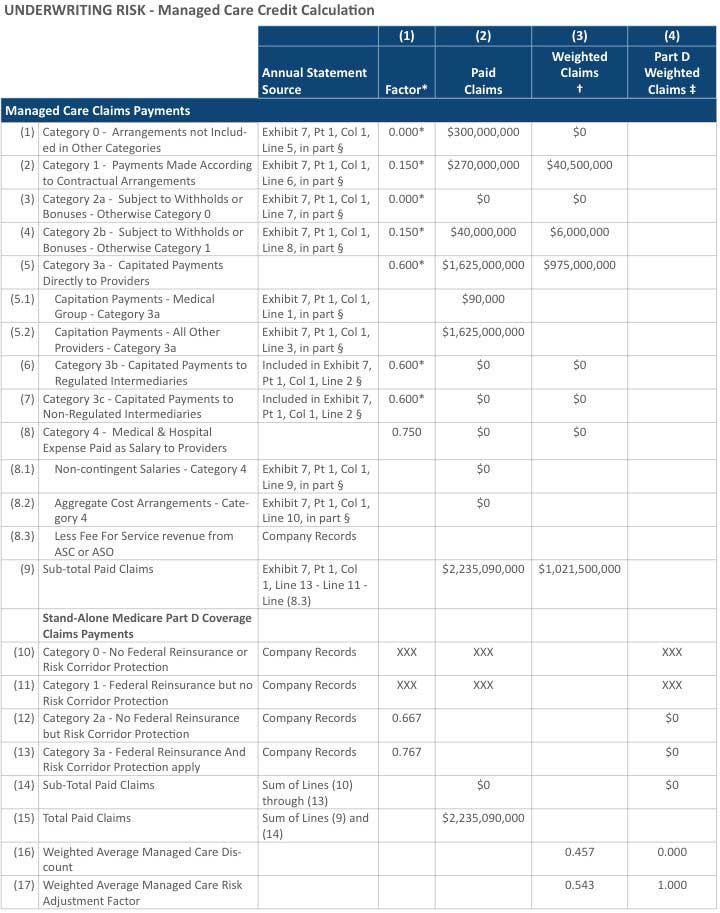
In the NAIC’s Health Annual Statutory statement, health plans are required to disclose claim payments by type of managed care arrangement, which flows to the Health Risk-Based Capital reports. As shown in Figure 1, column (1) “Factor” defines various managed care discount factors for different types of arrangements. The higher the factor, the greater the certainty with which future claim costs can be predicted and, therefore, the more favorable the RBC ratio calculation. Among all types, claims expenses paid as salary to providers scores the highest factor of 0.75, followed by capitated arrangements at 0.60, contractual arrangements at 0.15 and others with a risk factor of 0. The factors are then weighted by the number of claims in each category, and the weighted average is subtracted from 1.
Figure 1
Health Risk-Based Capital Report (page XR017)
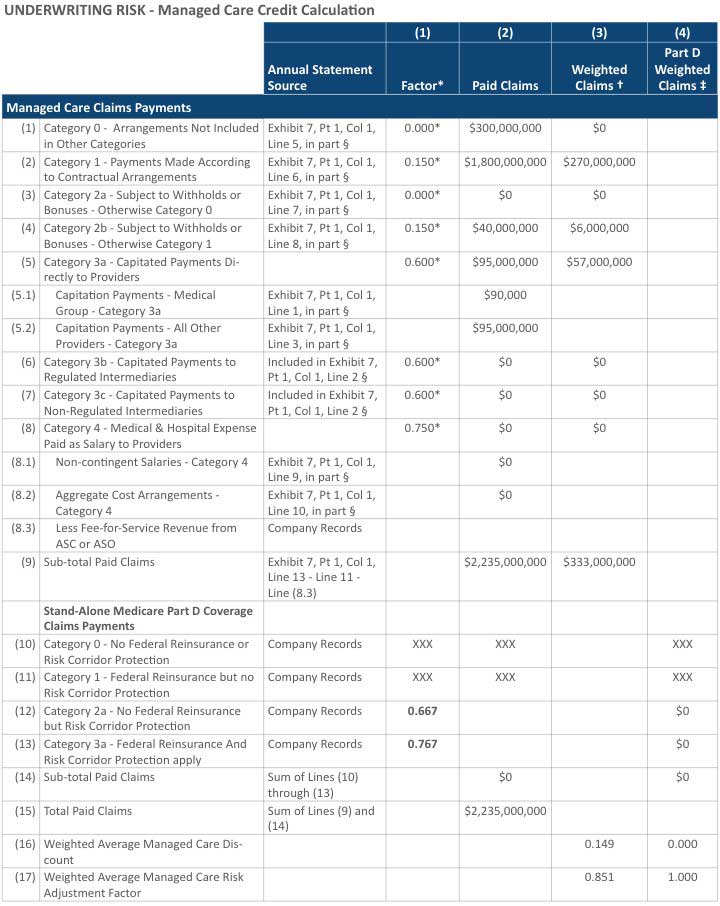
* The factor is calculated on page XR018.
† This column is for a single result for the Comprehensive Medical & Hospital, Medicare Supplement and Dental/Vision managed care discount factor.
‡ This column is for the Medicare Part D managed care discount factor.
§ Stand-alone Medicare Part D business reported in Lines (12) and (13) would be excluded from these amounts.
Company Strategies
How a health plan contracts with providers can have a significant effect on its RBC. An effective contracting strategy can have a favorable financial effect by reducing the amount of required capital.[2] The rise of value-based care contracting is all around us and in turn moves claims to a higher managed care credit category, which results in a favorable impact to a health insurer’s RBC.
We have also seen transformational integrations among health insurers, providers and pharmacy benefit managers. For example, the following headlines reference recent acquisitions:
- “Highmark Completes West Penn Deal, Announces New System”[3]—A Pennsylvania not-for-profit insurer, Highmark, purchased West Penn Allegheny Health System and formed the new Allegheny Health System.
- “CVS Creates New Health-care Giant as $69 Billion Merger with Aetna Officially Closes”[4]—CVS Health, which owns pharmacies, purchased Aetna’s insurance business; traditionally these are seen as two distinct lines of business.
- “Cigna to Acquire Express Scripts for $67 Billion”[5]—Cigna, a national health insurer, purchased pharmacy benefit management (PBM) organization Express Scripts.
These are not new types of transformations. We have seen companies expand beyond being the traditional roles of health insurers in the past as well:
- UnitedHealthcare created Optum Rx, a PBM and analytics company.
- Integrated Delivery Systems has combination payers and providers, such as Geisinger Health, Kaiser Permanente, Security Health Plan, Priority Health and UPMC.
Given these changes in the industry, the risk profile of insurance companies is also changing. The question we need to be asking is, “Should there be a consideration in the RBC formula to account for this new risk exposure?”
Case Study
Let’s look at the following example of the impact on the RBC ratio for the fictitious Accident and Health Insurance Company (AAHIC). It has a total of $2.2B in claims payments, which is composed of $95M paid claims under capitation arrangements, $300M paid under the traditional fee-for-service arrangement, and $1.8B paid under contractual arrangement. Other matrices are as follows:
- TAC = $286.4M
- ACL = $89.7M
- RBC = TAC/ACL = $286.4M/$89.7 = 319%
- Weighted average managed care discount = 0.149
- Weighted average managed care risk adjustment factor = 0.851
Figure 2 shows a summary of transactions with providers by type of managed care arrangement, while Figure 3 presents the calculation of managed care credit.
Figure 2
AAHIC’s Health Annual Statutory Statement
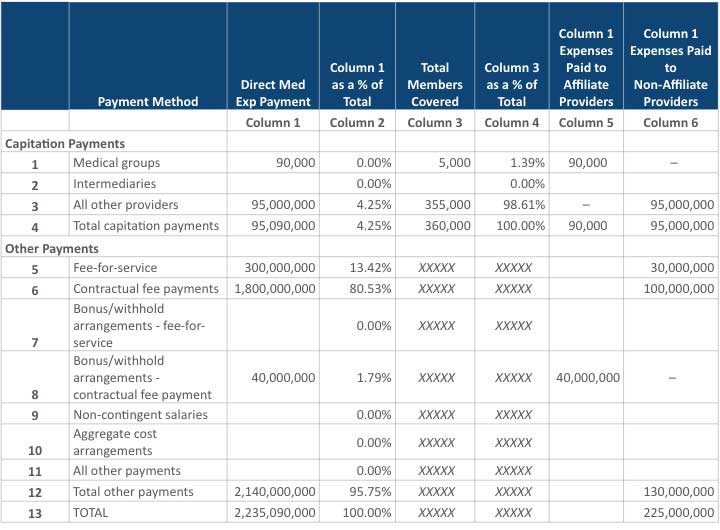
Figure 3
Health Risk-Based Capital Report (page XR017)
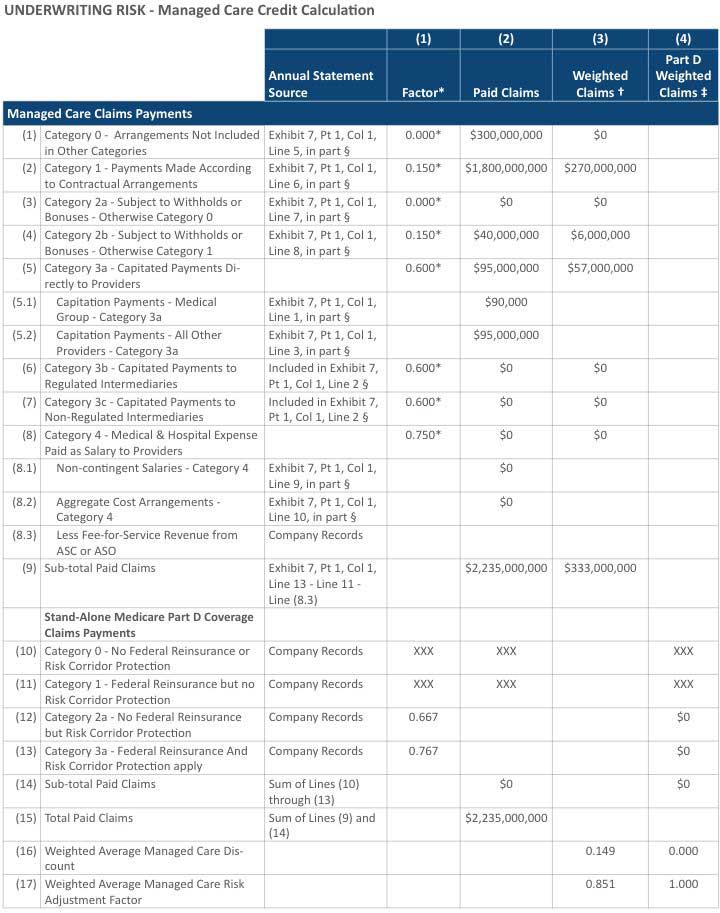
* The factor is calculated on page XR018.
† This column is for a single result for the Comprehensive Medical & Hospital, Medicare Supplement and Dental/Vision managed care discount factor.
‡ This column is for the Medicare Part D managed care discount factor.
§ Stand-alone Medicare Part D business reported in Lines (12) and (13) would be excluded from these amounts.
Now, assume that 85 percent of the company’s claim payments under contractual arrangement (line 6 in Figure 2) switched to a capitation arrangement (line 3 in Figure 2). As shown in Figure 4, the TAC remains at $286.4M, but the managed care discount increases from 0.149 to 0.457, the ACL drops from $89.7M to $61.5M, and the RBC ratio increases from 319% to 465%. If AAHIC takes some of its claims out of a capitated arrangement, the managed care credit category changes, and the RBC ratio will decrease accordingly. Figure 5 shows the calculation of managed care credit assuming 85 percent of the claim payments are switched from a contractual arrangement to a capitation arrangement.
Figure 4
AAIHC’s Revised Health Annual Statutory Statement
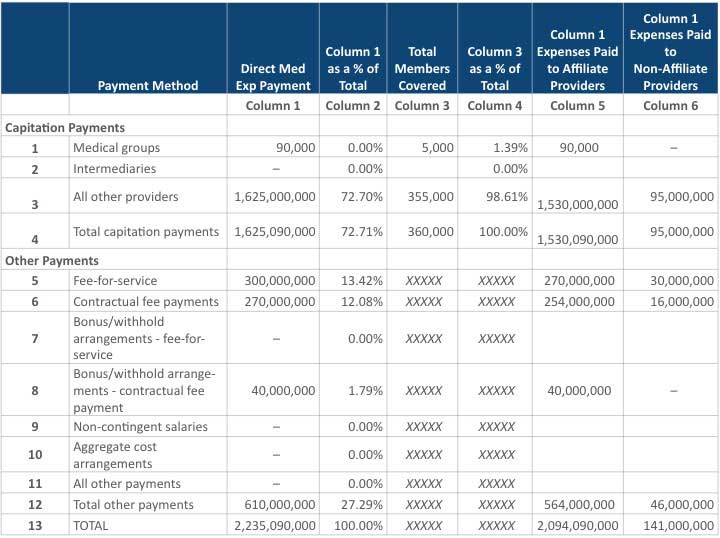
Figure 5
AAHIC’s Revised Health Risk-Based Capital Report (page XR017)
* The factor is calculated on page XR018.
† This column is for a single result for the Comprehensive Medical & Hospital, Medicare Supplement and Dental/Vision managed care discount factor.
‡ This column is for the Medicare Part D managed care discount factor.
§ Stand-alone Medicare Part D business reported in Lines (12) and (13) would be excluded from these amounts.
Conclusion
RBC is formally reported to regulators once a year in March; however, it is important to monitor company RBC levels throughout the year. RBC should be incorporated into your company’s enterprise risk management framework and observed within your audit committees. Having a good understanding of various risk factors has a profound effect on evaluating operational changes, managing insurance risks and making informed strategic decisions. Financially weak insurers should have open dialogues with the state insurance department to navigate through regulatory challenges with success. We are no longer seeing a tradition of organizations being only health insurers, and the new type of insurer combines other services such as providers and pharmacy. Given this market shift and change in business, will we see a change in the Health RBC formula to reflect the new types of arrangements in our near future?
Jinjun (Sophia) Yu, CPA, MBA, CHFP, is finance director at Geisinger Health Plan in Danville, Pennsylvania. She can be reached at jyu@thehealthplan.com.
Karena Weikel, ASA, MAAA, is chief actuary at Geisinger Health Plan in Danville, Pennsylvania. She can be reached at weikelkarena@gmail.com.