US Health Care System: Reality vs. Reform
By Kevin Wolf
Health Watch, March 2023
Adapted from https://www.graphicmedicine.org/comic-reviews/u-s-healthcare-system-reality-vs-reform/ posted August 2021 with permission from Kevin Wolf.
I’m going to be geeking out a bunch in this book review. The topic covered, the US health care system (USHCS), overlaps a lot with my professional life as a health actuary. I’m sorry if you find this review a bit statistics-heavy, but I can’t address the US system without such information. This graphic medicine triple-book review will be time traveling backward from 2021 to the early 2000s. In 2019, the most recent data available, the USHCS employed 16 million people, cost $3.8 trillion in total (over $11,000 per person) and was well over 17 percent of the US economy (gross domestic product); by far the most expensive health care system per capita anywhere in the world. And what does the US get for all this spending? Not much. We spend over three times the cost of any other of the 38 Organization for Economic Co-operation and Development (OECD) member countries on administration per person for the USHCS. The U.S. has the tenth worst life expectancy from birth (of 37 countries), fifth worst infant mortality (of 37), fifteenth worst control for asthma (of 35), and eighth worst of uncontrolled diabetes (of 35) to name a few parameters.[1] Other OECD countries typically spend 11.5% or less of their GDP on health care.[2] In 2019, the federal, state and local governments paid for about 45 percent of total US health care costs (see Figure 1).[3]
Figure 1
Who Pays for Health Care in the US? (2019 Percentages)
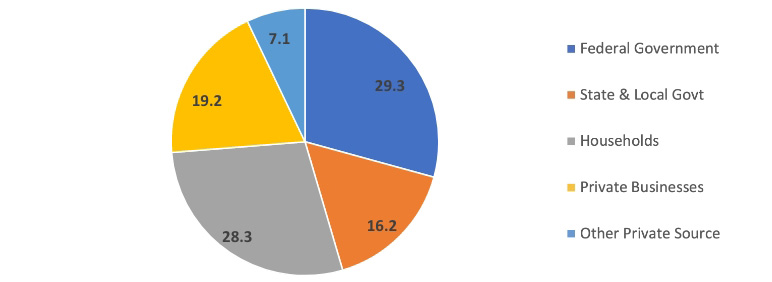
Source: Centers for Medicare & Medicaid Services (distributed 1 percent, rounding error, proportionately), https://www.cms.gov/files/document/highlights.pdf.
Out of all the OECD member countries, only the US does not have a national health care system of social insurance that ensures most of its citizens’ health care costs are affordable and covered. The USHCS has been and continues to be ad hoc, messy, inequitable, mostly employment-based, partly socially insured (e.g., Medicare), some joint-federal/state-administered (Medicaid, CHIP), alphabet-souped (PPO, HMO, FSA, HSA, ACO, HRA and so on), opaque, unhealthy, tremendously expensive and hopefully fixable. It’s so complicated, I can’t even give a simple explanation of who’s covered by Medicare[4]—the US’s pre-eminent social health insurance program.
This brings me to my review of three graphic works about the USHCS. Health and Wealth is a comic book published in July 2021. Health Care Reform came out in 2011 to explain the Patient Protection and Affordable Care Act (ACA, aka Obamacare); and the illustrated Field Guide to the U.S. Economy was published in 2006. The latter provides some health care statistics to compare how much (or little) the USHCS has changed since the late 1990s or early 2000s.
Health and Wealth
Health and Wealth, a comic book published by Center for Cartoon Studies and authored by many,[5] provides an excellent, detailed picture of the current USHCS and offers some prescriptions for improvements. In 27 pages, often with double-page explanations of difficult subjects (e.g., insurance), the authors/cartoonists provide a wealth of information; though some information might be too abbreviated or sometimes in error (e.g., see discussion about relative value units later). Health and Wealth mimics Richard Scarry’s illustrated books by showing—in his drawing style—lots of anthropomorphized animals who speak or join the narration. Health and Wealth starts with an ideal scenario (including a doctor giving an oath[[6]]) and ends with requiring action for the close-to-ideal to come to fruition. A lot of important information about the United States’ health care system is packed into this comic book, with a variety of imagery to keep it entertaining and fairly absorbing. I highly recommend Health and Wealth. The creators are hoping this comic will be widely distributed.
Unlike an ideal health care system (pages 1–3), the USHCS is shown metaphorically (and apropos) as an unworkable mix of board games (Life, Chutes & Ladders, and Monopoly) glommed together haphazardly and held together with band aids (4–5). Health and Wealth explains where or how some people fit into the USHCS (6–7).
A brief history of US hospitals is provided from seemingly aged-sepia imagery of a walled almshouse (1800s hospital for the poor) to colorful, modern, glassed hospitals of today (10–11). Hospital billing practices are explained through a facility’s open cross-section (12–13), with a lot of details: for example, “Medical students graduate from school with a mean debt of $170,000. In other countries medical school is far cheaper or free. [So, US] Doctors are under pressure to generate revenue from the get-go” (12).
The comic does go too far at times. For example, it indicates that there are fees for just sitting in a waiting room (12); there aren’t, but part of the bill—when services are rendered—is for overhead and facility costs. The fees charged without discounts from insurers, Medicare or Medicaid can be outrageously high and bankrupting for the uninsured. Health and Wealth does an excellent job of reinforcing how confusing the USHCS is (e.g., in-network vs. out-of-network often not known without research on patient’s part) and how costs are virtually unknown until bills arrive. The comic does confuse hospital reimbursement with physician reimbursement (post-review correction: Before the comic book went to the printer, this reimbursement was changed to physicians not hospitals); and the creation of how hospitals are reimbursed.[7] It’s true, as the comic states, “The entire system lacks transparency, standardization and comprehensive patient protection.” (13)
The comic, for its size, does a great job explaining difficult topics. Health and Wealth shows that health insurance’s founding was connected with Dallas, Texas’s Baylor (University) Hospital (administrator) Justin Ford Kimball.[[8]] There’s an excellent discussion (16–17) of President Truman’s attempt at national health care, politicized pejoratively as “socialized medicine” by the American Medical Association. Outside Health and Wealth, there were cartoonists on the other side—or at least who were hired to be—of the national health care debate at that time. Famed cartoonist Will Eisner was hired by the Baltimore City Medical Society in 1950 to produce “The Sad Case of Waiting-Room Willie” to fight socialized medicine.[[9]] Jared Gardner, a professor at Ohio State University, wrote an excellent article on cartoonists and President Truman’s attempt at national health care.[10]
There are three major groupings of USHCS covered/uncovered persons (2019 counts[11]): publicly insured (Medicare—58 million people, Medicaid—64 million, veterans—7 million); privately insured (employer—179 million, individual—42 million, military—9 million); or uninsured—29 million,[[12]] for a total of 323 million. Note there is some overlap, such as some people covered by both Medicare and Medicaid.
Health and Wealth shows some photographic images of Americans protesting against the American Medical Association’s attempt to stop the passage and others marching for the passage of Medicare/Medicaid social insurance programs (16–17). Medicare and Medicaid were signed into law by President Johnson and implemented in 1965.
The comic’s final story (22–26), “A Tale of Two Snakes,” has both a reality-based and a hopeful, reform-minded aspect when the wider community of patients and the public provides questions and solutions.[13] At the end of Health and Wealth, there is a list of useful resources (27) including Kaiser Family Foundation, Physicians for a National Health Program, and Graphic Medicine International Collective, as well as a few books for further reading. Page 28 shows a discussion/activities guide, and page 29 has a glossary of terms. Some terms are only mentioned in the glossary (e.g., “Affordable Care Act” and “health maintenance organization”). Therefore, the reader should think of the glossary as going beyond the narrative of the comic as a whole.
Health Care Reform
Health Care Reform: What It Is, Why It’s Necessary, How It Works is written by Jonathan Gruber (economics professor at MIT, a member of the Institute of Medicine, and a former assistant deputy secretary for Economic Policy in U.S. Treasury Department) with HP Newquist and illustrated by Nathan Schreiber. Gruber, one of the primary creators of the ACA, is a character in and narrator of Health Care Reform. This graphic work provides simplified information about the USHCS, such as insurance is for not having to pay the “full cost for expensive medical treatment . . .” (page 12). Health Care Reform indicates that in the first decade of this century those in the US fortunate enough to have employer-provided coverage had little out-of-pocket (the amount patients pay) expenses.[14]
Before the ACA, people in the US could be denied coverage for a preexisting health condition, and the uninsured often couldn’t afford to get sick. According to studies, about two-thirds of the people in the US filing for bankruptcy pre- and post-ACA still indicate that medical issues (health care cost or time off work) contributed to their bankruptcy.[15] Gruber also explains how a Massachusetts experiment was a source of the ACA.[16]
Health Care Reform gives examples (38–42) of very inefficient spending with few positive health benefits, such as overuse of emergency rooms and underuse of preventive services, and doctors paid for the quantity—not necessarily quality—of services rendered. These fee-for-service payments may lead to overprescribing services, tests, and medications (43–44).
Gruber creates strawmen by claiming that a single-payer-government-developed plan on the left or, alternatively, ending government-supported health care (i.e., Medicare/Medicaid) on the right has equal problems, without explaining what those problems might be (48–49). Therefore, his proposal, which became the ACA, works best. He advocates for what Massachusetts implemented under Republican Governor Mitt Romney (50–58), which relied on Gruber’s and others’ advice at its creation.
I won’t go into depth to explain the ACA and how it works, since it was implemented between 2010 and 2014 and you probably already know about it. Keep in mind Health Care Reform was published in 2011; years before the ACA was fully implemented. Gruber narrates, “The major accomplishment of the ACA is to provide true security to the insured in the U.S.” (67). There’s a minimum standard 10 categories of benefits that must be covered (called Essential Health Benefits).
Since a public option (e.g., Medicare-like) was missing from the ACA, only private insurance through insurance companies is available under the act. Had there been a public option, then it would’ve been easier to gauge how many people wanted to buy private insurance vs. signing up for or being put into a government-designed public option benefit package like Medicare. (Full disclosure: Pre-ACA, I had proposed a public/private mix of coverage with those not selecting either being automatically enrolled in the public plan.[17]) Without the public option, some areas in the US offer very few (possibly only one) exchange options and may have very narrow health care provider networks as the private option.
Health Care Reform discusses the fearmongering surrounding the ACA before and after the law passed, but it couldn’t know if any of those fears would materialize. Here are the fears and whether they occurred through 2019, the most recent year with data available:
- Fear: The uninsured won’t be covered. ACA initial claim: The uninsured population will decline by 32 million before 2020.[18] Fact: The uninsured count decreased about 17.5 million by 2019, partly due to twelve states not accepting one aspect of the ACA—Medicaid expansion. One state (Missouri) hasn’t implemented its Medicaid expansion yet.
- Fear: Employers providing insurance will decrease by 2 percent. (Employment-based health insured was 55.1 percent of the US. population in 2010[19]) Fact: In 2019, 56.4 percent of the population was covered by employers.[20]
- Fear: The government will take over health insurance. Fact: There were increases in the number of those with private insurance; a public—government—option wasn’t created.
- Fear: Insurance premiums will increase, but the Congressional Budget Office (CBO) expected the ACA to have little effect on health insurance premium increases. Fact: Insurance premiums increased 54 percent between 2009 and 2019 (about 4% per year compounded), which is reasonable compared to higher historical trends).[21]
- Fear: The ACA will explode the national debt. Fact: Original estimates by the CBO concluded that by 2019 the ACA would reduce the deficit by $143 billion, and the second decade would reduce the national debt by $1 trillion. The actual fact is unknown because the ACA wasn’t implemented as planned (e.g., the tax penalty to individuals was eliminated with President Trump’s 2017 tax reduction, which increased deficits; the Cadillac tax was deferred from 2018 to 2022 under the Trump administration; and 12 states didn’t implement Medicaid expansion).
The ACA included several experiments to see if any might control costs, but it’s unknown how well they might have worked.
- Cadillac tax (mislabeled as “Cadillac Exchanges” in Health Care Reform). This tax penalty was to be on extremely comprehensive plans with very low out-of-pocket-expenses (aka, Cadillac plans), but its impact was deferred by the Trump administration until 2022.
- Exchanges. These were supposed to provide competitive marketplace for coverages. There’s competition in many locations, but some locations might have only a single offering (e.g., Delaware has only a single insurer on the exchange[22]).
- Independent Payment Advisory Board (IPAB). No members have been appointed to the board, so its impact is unknown.[23]
- Comparative Effectiveness Research (CER). I couldn’t find an explanation of what this is or if it was implemented.
- Accountable Care Organizations (ACOs). Rather than pay for each service as they occur, ACOs pay a global capitation payment for all covered services. By 2019 there were about 1,600 ACOs, 60 percent under private insurance, covering about 40 million lives in total.[24]
The illustrations in Health Care Reform are rather pedestrian, with almost no shading, shadows or backgrounds. The comic uses many metaphors in the imagery. For example, an ocean might toss about the nonemployment-based insured with increasing costs or decreasing benefits. The ocean could become a tidal wave, so a lifeboat (personal health or low-cost/high-deductible coverage) may not help if one doesn’t have a lot of personal assets. A two-headed alligator has one head for rising health costs, and the other is labeled “uninsured.”[25]
There are some annoying aspects to Health Care Reform. One example has Gruber flippantly sending an uninsured woman off to an emergency room for the second time (first for a heart attack and second for being hit by a car) to demonstrate how the rest of us pay her cost through higher hospital bills or insurance costs, but it doesn’t mention that her unpaid-for emergency services are already subsidized by higher payments (called “Dish” for disproportionate share subsidies) from Medicare reimbursement. The emergency room is the only place an uninsured person can’t legally be turned away from health care services in the US. Health Care Reform is presented like the Socratic method where other characters are sometimes manipulated by Gruber either to be misguided examples or to allow the professor to explain why we should believe that he has the answer for the problem they encounter. There’s an amusement park (28–29) of lousy insurance coverage if one loses one’s job, but no mention of COBRA.[[26]] Health Care Reform ends smarmily as a glorious day of ACA providing coverage for everyone at lower cost. The ACA didn’t fulfill this promise, partly because it was politically eroded and partly because it wasn’t set up to give coverage to those who refused to sign up. On the positive side, Gruber views the ACA as a first step that can be adjusted as the need arises. But given that one political (Republican) party is against it, it’s extremely difficult to fix and easy to chip away at. He implies we’re marching toward a positive future, while even back in 2011, it was more likely to be an uncertain one!
Field Guide to the U.S. Economy
The Field Guide to the U.S. Economy: A Compact and Irreverent Guide to Economic Life in America by Teller-Elsbergg, Folbre, Heintz, and The Center for Popular Economics has one chapter (chapter 7, pages 109–26) with 16 charts, cartoons and commentary on health. There are several other health-related issues elsewhere, such as homicide rates (10), losing employer-provided health insurance (27), workplace deaths (29), reproductive rights (53), federal spending by category (77), health and environment (132) and climate change (143). This Field Guide is illustrated with comic strips/panel cartoons by over 40 cartoonists. The acknowledgments include websites (some may no longer be active) for many cartoonists (x). I recommend the Field Guide for its historical value, and sadly, for identifying many disparities that have worsened since its publication.
Since the Field Guide emphasizes charts of statistics (with sources provided) and commentary from over 15 years ago—having been published in 2006—I am going to quote from the introduction, “The Bottom Line,” at some length to benefit the 2023 reader:
- Economic experts are far more likely to extol the virtues of the [U.S. economy] than criticize it. . . . Some economists (like us) disagree. We believe that economic power in the U.S. is unevenly distributed and easily abused and that current economic policies are inefficient as well as unfair. We also believe that good citizens should be good critics, and that controversy and debate over economic issues are central to the democratic process. This book compiles useful information for non-economists . . . who want to know more about the U.S. economy. The facts and figures we highlight reflect our personal values and our political concerns. But we stop short of developing any one interpretation of U.S. economic trends or advocating any particular social policies. [xiii–xiv]
- [Regarding Chapter 7] The U.S. health care system has been sick for years, but political bickering and special interests continue to block an effective cure. The problems are chronic: many Americans lack health insurance, prices for care keep climbing at a rapid pace, and the quality of care too often depends on a person’s ability to pay. . . . Other countries are able to provide their residents with health care for a smaller fraction of gross domestic product. They also get more bang for their health care buck . . . [109]
These words about the USHCS could have been written today; they’re only much more costly today. Chart 7.1 shows US health care spending was 14 percent of GDP in 2001, 11 percent in Germany and Switzerland, 10 percent in Canada, and 8 percent in the UK and Japan. The US has had the biggest change, with it now being 18 percent of a much larger economy in 2020. Chart 7.2 shows health care spending per person in 1999 was about $4,500 with life expectancy at 79.2, while the same countries plus France and Italy had much lower per person spending and greater life expectancy than the US. The latter table goes with a comic strip of a large quilt covering a Canadian in bed, while an American is covered by a small American flag (Barrie Maguire editorial cartoon) to protect him. Other topics with imagery include average price increases between 1980 and 2004 were for all goods (129 percent), health care (314 percent), physician’s services (254 percent), prescription drugs (365 percent) and hospitals (504 percent).
Where I’m Coming From’s comic strip creator, Barbara Brandon-Croft, provides her iconic visuals of African-American women saying, “Can you believe my premiums have gone up and my coverage has gone down?” [and one woman is disappointed at negative lab results because] “I have to pay for that lab test . . . I hoped something at least would be wrong with me” (114). Data show that a greater percentage of people of color are uninsured (Chart 7.7, 117), with an editorial comic by Khalil Bendib showing a health clinic window Yesterday for “Whites Only,” while for Today it’s for “Insured Only”; his often-appearing bird sarcastically says, “Not the same difference.” Infant mortality was worse for African-American/Indigenous people than for whites by over 100 percent/40 percent, respectively in 1984–2001, as illustrated by a Jeff Parker editorial cartoon (Chart 7.8, 118). Bankruptcy causes were often medically connected (Chart 7.12, 122), even for the 76 percent who had health insurance at the start of their illness, as shown with an editorial cartoon by Jen Sorenson. Chart 7.14 (124) demonstrates that back in 2001 major drug companies had revenue portions of 11 percent, 18 percent and 27 percent spent on research and development; profits; and marketing, advertising and administration, respectively. A Carol Simpson (collaboration between artist Estelle Carol and writer Bob Simpson) cartoon shows pharmaceutical executives saying, “This one shows great promise . . . it keeps the patient alive until their money runs out.”
Unfortunately, missing from all the graphic works reviewed here is a discussion of any other country’s universal health care system. It would’ve been helpful to read/see what’s done elsewhere, its cost, how it’s paid for and health outcomes. Fifty-one other countries (including Canada, Mexico, Japan, and many in Europe, South/Central America and the Middle East) have a universal health care system where everyone is covered, except perhaps noncitizens.[27] Even then, at least some countries have reciprocity agreements among themselves to provide health care services to traveling citizens of other universal-healthcare-system countries with typically very low out-of-pocket expenses.[28]
The more things don’t change, the more they stay the same! When I graduated college in 1979, US health care spending was 9 percent of the GDP. It was 14 percent in 2001 (Field Guide), 17 percent in 2010 (Health Care Reform) and 18 percent in 2020 (Health and Wealth). The projection from the CMS Office of the Actuary estimates it will by 19.4 percent (almost one-fifth of the economy) by 2027.[29] Perhaps Health and Wealth can start a reversal . . . hope springs eternal!
Whew. Congratulations, you made it to the end of this review!
Statements of fact and opinions expressed herein are those of the individual authors and are not necessarily those of the Society of Actuaries, the editors, or the respective authors’ employers.
Kevin Wolf, FSA, is a retired consulting actuary, formerly at Kevin Wolf & Associates. Kevin can still be reached at kevin.wolf.associates@gmail.com.
Endnotes
[1] How Does the US Healthcare System Compare to Other Countries? Peter G. Peterson Foundation, July 19, 2022, https://www.pgpf.org/blog/2022/07/how-does-the-us-healthcare-system-compare-to-other-countries (accessed Feb. 15, 2023).
[2] Organisation for Economic Co-operation and Development. Health Expenditure and Financing, OECD.Stat, Dec. 5, 2022, https://stats.oecd.org/Index.aspx?DataSetCode=SHA (accessed Feb. 15, 2023).
[3] Centers for Medicare and Medicaid. National Health Expenditures 2020 Highlights, CMS.gov, July 31, 2021, https://www.cms.gov/files/document/highlights.pdf (accessed Feb. 15, 2023).
[4] Medicare-covered persons are typically those at least age 65, or meeting the definition of disabled under age 65 for 24 months, unless it’s ALS (amyotrophic lateral sclerosis; aka Lou Gehrig’s disease) then there’s no wait, or suffering from end-stage-renal-disease under specific conditions; but you also have to be a US citizen or “lawfully present immigrant,” which has its own list of qualifiers.
[5] Including lead cartoonists: James Sturm and Kazimir Lee; research, writing and editing: Dominick Contreras, Marissa Diggs, Emma Forbes, Sam Nakahira, Ava Salzman and Alisha Yi; design assistance from Ivy Albe; and various Harvard students.
[6] Health and Wealth uses an oath different from the Hippocratic oath; and doctors don’t actually take the Hippocratic oath—which have classical and modern versions—and is nonbinding, anyway. Others have boiled it down to “Do no harm.”
[7] The primary form of hospital reimbursement is not relative value units (RVUs; mentioned on page 12), nor was it developed by hospitals. The Centers for Medicare and Medicaid Services (CMS) developed RVUs for reimbursing physicians, not hospitals; while CMS reimburses hospitals based on MS-DRGs (Medicare severity, diagnosis-related groups), but the point the comic makes about upcoding (13) is a valid one. Insurance companies typically mimic CMS’s reimbursement methodology for hospitals and physicians, but usually at a higher rate than Medicare reimbursement levels. Unless you’re an actuary and know the coding for particular health care services, the reimbursement calculations are very difficult to understand and generally unknown to the patient in advance of services being rendered.
[8] Kimball helped develop the first “insured” coverage for the Baylor teachers for 21 days of hospitalization at a small annual fee. My addition: within 10 years, 3 million people across the country were in similar hospital plans, which became unified under the Blue Cross symbol.
[9] Reprinted as Eisner, Will. 2005. Waiting Room Willie. The Comics Journal no. 267: 151–65. https://www.tcj.com/tcj-archive/the-comics-journal-267-aprilmay-2005/ (accessed Feb. 15, 2023).
[10] Gardner, Jared. Presidential Medicine: Truman. Drawing Blood: Comics and Medicine, Nov. 2, 2019, http://drawing-blood.org/presidential-medicine/presidential-medicine-truman/ (accessed Feb. 15, 2023).
[11] Keisler-Starkey, Katherine, and Lisa N. Bunch. Health insurance in the United States: 2019–Tables. Report #P60-271. United States Census Bureau, Sept. 15, 2020, https://www.census.gov/data/tables/2020/demo/health-insurance/p60-271.html (accessed Feb. 15, 2023).
[12] The uninsured pay 100 percent of health care bills—possibly after ad hoc negotiations with the billing department—out of their own pocket.
[13] The chapter being “inspired by the Caduceus, the staff carried by Hermes, the patron of commerce and traders as well as thieves, liars, and gamblers . . .” and the two-headed snake entwining the staff of Asclepius—Greek god of medicine and healing—which has become the western symbol of medicine (26).
[14] In contrast to today when, according to Society for Human Resource Management (SHRM), the average estimated employee’s health care costs for themselves, a spouse and children in 2021 were $4,650, while the employer’s were $10,850; this is about a 40 percent increase since 2010, when the ACA was signed into law by President Obama.
[15] Konish, Lorie. This Is the Real Reason Most Americans File for Bankruptcy. CNBC, Feb. 11, 2019, https://www.cnbc.com/2019/02/11/this-is-the-real-reason-most-americans-file-for-bankruptcy.html (accessed Feb. 15, 2023).
[16] Though Massachusetts (MA) had a fairly low portion of uninsured (6% in 2006), the rising costs for their care was a concern. Gruber and others were asked by MA governor Romney to develop a solution. In 2006 MA health care reform law (aka, Romneycare) passed and created the Commonwealth Health Insurance Connector Authority (MA Health Connector). By 2010 the uninsured in MA was about 4 percent and about 3 percent in 2019. The state’s health care reform had three requirements: preexisting conditions to deny coverage weren’t allowed by insurers, people were penalized if they didn’t buy insurance (aka individual mandate), and a premium subsidy was provided for low-income persons. The uninsured could pick their own private insurance health plan. This was funded through existing taxes on insurers and hospitals plus federal monies for the uninsured. Gruber indicates there were pluses (e.g., the number of uninsureds declined), and minuses (e.g., costs weren’t controlled).
[17] For the outline of my proposal, see Wolf, Kevin. 2009. U.S. Health Care System Proposal: Private and Public Choice. Visions for the Future of the U.S. Health Care System #81. Schaumburg, IL: Society of Actuaries, https://www.soa.org/globalassets/assets/files/resources/essays-monographs/future-us-healthcare/health-essay-2009-wolf.pdf (accessed Feb. 15, 2023).
[18] The Congressional Budget Office (a nonpartisan arm of Congress that estimates the impact of legislation) expectations at the time the ACA was proposed in Congress.
[19] Janicki, Hubert. Employment Based Health Insurance: 2010. United States Census Bureau, Feb 1, 2013, https://www.census.gov/library/publications/2013/demo/p70-134.html (accessed Feb. 15, 2023).
[20] Keisler-Starkey and Bunch, 2020.
[21] Kaiser Family Foundation. 2019 Employer Health Benefits Survey. KFF, Sept. 25, 2019, https://www.kff.org/report-section/ehbs-2019-section-1-cost-of-health-insurance/ (accessed Feb. 15, 2023).
[22] Mcdermott, Daniel, and Cynthia Cox. Insurer Participation on the ACA Marketplaces, 2014–2021. KFF, Nov. 23, 2020, https://www.kff.org/private-insurance/issue-brief/insurer-participation-on-the-aca-marketplaces-2014-2021/ (accessed Feb. 15, 2023).
[23] Cubanski, Juliette, and Tricia Neuman. FAQs: What’s the Latest on IPAB? KFF, Nov. 3, 2017, https://www.kff.org/medicare/issue-brief/faqs-whats-the-latest-on-ipab/ (accessed Feb. 15, 2023).
[24] Muhlestein, David, William K. Bleser, Robert S. Saunders, Robert Richards, Elizabeth Singletary and Mark B. McClellan. Spread of ACOs and Value-Based Payment Models in 2019: Gauging the Impact of Pathways to Success. Health Affairs, Oct. 21, 019, https://www.healthaffairs.org/do/10.1377/forefront.20191020.962600/full/ (accessed Feb. 15, 2023).
[25] Gruber found the percentage of GDP spent on health care was 5 percent in 1950 and 17 percent in 2010, but it hasn’t gone down since the ACA was implemented. It’s now about 18 percent of GDP and expected to continue to rise. The ACA has reduced the uninsured population from 46.5 million (17.8 percent) in 2010 to 29 million (9.0 percent) in 2019, primarily due to Medicaid expansion under the ACA, the creation of the ACA health insurance exchanges and economic improvement.
[26] COBRA is time-limited coverage available to most employees who lose their job, if they can afford to pay 102 percent of their employer’s premium rates.
[27] Kiprop, Victor. Countries with Universal Health Care. World Atlas, Jan. 29, 2018, https://www.worldatlas.com/articles/countries-with-universal-health-care.html (accessed Feb. 15, 2023).
[28] Services Australia. Reciprocal Health Care Agreements. Australian Government, updated Dec. 20, 2021, https://www.servicesaustralia.gov.au/reciprocal-health-care-agreements (accessed Feb. 15, 2023).
[29] Office of the Actuary. CMS Office of the Actuary Releases 2018–2027 Projections of National Health Expenditures. CMS, Feb. 20, 2019, https://www.cms.gov/newsroom/press-releases/cms-office-actuary-releases-2018-2027-projections-national-health-expenditures (accessed Feb. 15, 2023).