Life JRMS Survey
By Frank Reynolds
Risk Management, April 2021

The Council of the JRMS considered the problems that would arise in trying to calibrate ERM models for the pandemic. It was felt that providing comparative figures for the industry would provide useful guidance for practitioners in justifying and making changes in these models. Unfortunately, the pandemic and U.S. anti-trust laws slowed the process more than anticipated so that the results could not be available before year end. In the hope that they still may be of use, this report gives a summary of the data reported.
Although the results of the survey were very disappointing in terms of number of replies, some insights may still be inferred from the limited responses. For most questions, the most common reply was “unknown,” indicating the expected uncertainties brought by the pandemic.
Eighty percent of the results came from the US and 13 percent from Canada. The rest were from Asia.
By industry, 82 percent of responders were life, 10 percent were annuity and 8 percent were health.
By size, most (26) were medium, six were small (under 500 million of premium) and seven were large (over 50 billion of premium).
With respect to productivity, one respondent reported a decrease, 12 no change, and two an increase.
Ten companies expect working from home to continue after the epidemic, three are not sure, and one expects a return to the office.
The survey considered two important concepts—how risk models compared with reality and what information was available to update the models.
Performance
The following table shows how well the models were judged to perform (15 respondents)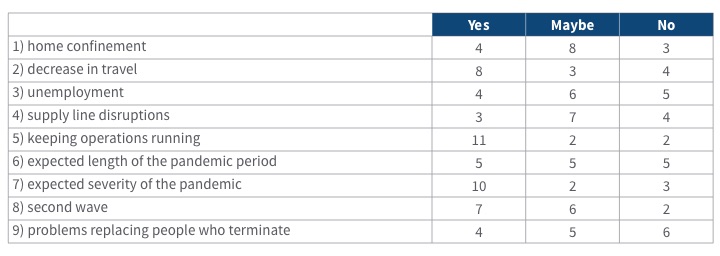
Overall, the models were deemed to work well on 42 percent of the major areas of concern and poorly on 25 percent, with the rest being so-so.
The models accounted well for the decrease in travel, the severity of the epidemic, and the ability to keep operations running. They showed weakness in the supply line disruptions, the extent of home confinement, unemployment, and in the problem of replacing people who terminate.
Splitting the results by epidemic versus results of the epidemic indicates that while the severity was well predicted, there was a weakness in predicting the length and the second wave. By and large the results were not well predicted—supply line disruptions, home confinement, unemployment, and problems with replacing people who terminate. Since the results lead to estimates of financial effect and are the purpose of building the models, it would appear that a lot of revision of thinking is in order.
Experience Changes by Line of Business
Note: in many cells the number of respondents was about five or less, so the results are not actuarially significant.
- Individual
- Life—of the 11 respondents most reported no changes. For some companies, claims rose but increases and decreases for lapses and policy loans netted to near zero.
- Annuity—most respondents reported no change with increases and decreases in claims, lapses and policy loans being slightly positive.
- Disability—the five respondents reported no change in lapses and a small net increase in claims.
- Long-term care—the five respondents reported a net decreases in claims and lapses, although most reported no change.
- Critical illness—no changes in claims or lapses were reported.
- Group
- Life—most respondents reported no change, with the remainder reporting a net increase
- Annuity—no changes were reported.
- Disability—general claims and lapses showed little or no net change. Claims due to unemployment rose an average of 5 percent.
- Long term care—most reported no change in claims, unemployment claims, or lapses, while some showed small decreases.
- Critical illness—most reported no change in claims, unemployment claims, or lapses, while some showed small decreases.
- Separate accounts
- Four reported no change in redemptions while three reported decreases averaging 10 percent.
Statements of fact and opinions expressed herein are those of the individual authors and are not necessarily those of the Society of Actuaries, the editors, or the respective authors’ employers.
Frank Reynolds, FSA, MAAA, FCIA, is chair of the Joint Risk Management Section, a retired university Professor and president of Reynolds, Thorvardson, Ltd. He can be contacted at fgreynol@gmail.com.