The Importance of Exposure Modeling
By Mojum Khan
Risk Management, April 2022

This article first appeared on the AXA XL website Climate Risk | AXA XL in March 2021. It has been updated and reprinted here with permission.
The Importance of Exposure
Risk is a function of hazard, exposure and vulnerability. Understanding exposure is a key aspect of the risk equation and critical in understanding the risk we face both now and in a changing climate. Exposure is defined as the amount of an asset that is exposed to the hazard in a given space and time. Without any exposure, we do not have any risk.
For example, in 2013 the category 5 typhoon Lekima in the Northwest Pacific Ocean had peak wind speeds of over 240km/h, however it caused no casualties or damage to property due to its location. In the same year Typhoon Haiyan, a category 5 storm hit the region of Yolanda, with peak windspeeds over 315km/h. Haiyan affected nearly 11 million people, causing more than 6,000 casualties and the loss of more than USD$1.5 billion. It is clear from these examples the importance that exposure plays in determining the risk that is faced from a particular event.
In this section we describe what is being done by AXA XL in understanding clients’ exposure from a data quality, data enrichment, risk insight and event response perspective.
Data Quality: Evolving Over Time?
When it comes to data collection and data analysis, the insurance industry has come a long way over the last 20 years. In the late 1990s data was provided in spreadsheets with aggregate exposure data in the US, whereas in the early 2000s data was primarily provided in vendor model databases with some improvements in data quality. We are now seeing data provided at street level and in some instances at building level. Having this detail is important for a hazard like wildfire or flood, where the damage can be isolated at building level. These improvements are also beginning to be seen in other territories like Europe, but data quality remains poor in a number of other larger territories and non-peak in less well modeled zones.
We provide our underwriters with data quality reports for each of our clients, highlighting where we see issues and building up a risk ranking framework allowing us to gain insight on relative performance of our clients. In certain territories we are driving conversations with both our brokers and clients to improve the data quality and providing insight into what is driving loss uncertainty.
Data Enrichment: Ground Truth Florida Property Risks
While we have highlighted improvements in the granularity of data being provided, there is a new issue that needs to be addressed, which is how this data compares to the ground truth of the actual property. For example, how does the roof geometry or roof type provided by clients match with what we see from spatial imagery of the property? (see Figure 1)
For this purpose, we have partnered with a third-party company called Cape Analytics. Using their programming interface, we have enriched roof geometry and roof type secondary modifiers for our Florida clients as these both have a significant impact to the vulnerability of a structure in a tropical cyclone event. The enriched client locations yield a 0 percent to 20 percent difference in expected loss compared to the original loss. We are now looking to expand our discussions with Cape Analytics to detect roof condition (proxy for age), tree overhang, proximity to trees and the presence of debris. We feel that the addition of these attributes to the roof geometry will get us closer to the true view of exposure and so a clearer understanding of risk, especially in wind and wildfire exposed states. Data enhancements are key to us improving our ground truth and alongside the above description, we also make use of data from other sources, like taxation data from the US, to assess these ground truths and continue to enhance the detailed data that we have available to run in our vendor models.
Figure 1
Aerial Imagery Clip Used by Cape Analytics for Their Deep Learning Analysis in Extracting Building Attributes and Hazard Proximity
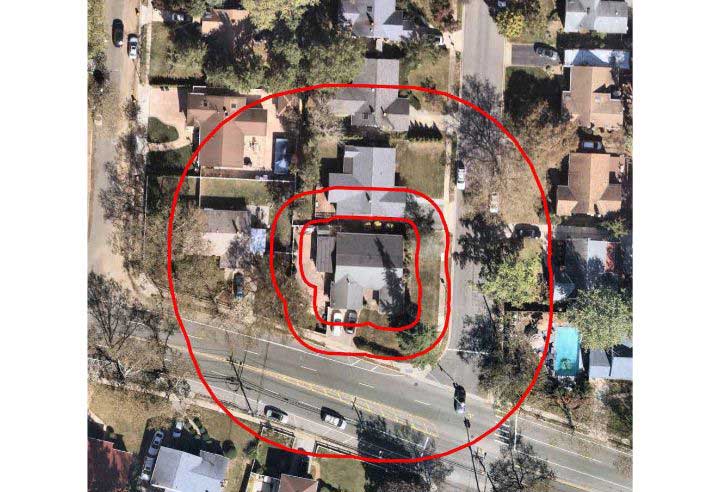
Figure 2
Comparing Building Attribute Data Provided by our Cedants to Ground Truth (Taxation and Imagery Based)
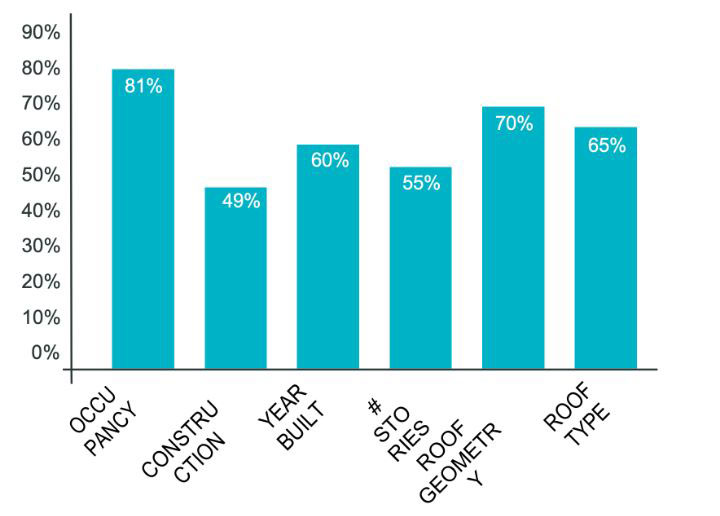
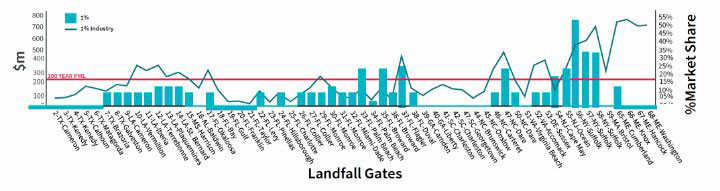
Figure 3
Given a Hurricane has Occurred, What is the 1 percent Chance of Loss for Different Landfall Gates, Compared to 1/100 PML and Industry
Risk Insight: Understanding Risk Profiles
One way to ensure we understand the risk profile of our clients, removing the ever-changing annual frequencies in landfall events from our models, is to take a deterministic perspective on our risk. For example, why not simply ask the question, “If a category 3-5 event made landfall what could our potential loss be?” Figure 3 demonstrates how we would look to answer this question.
The above graph removes uncertainty around frequencies and shows the results for losses for various categories of storms and whether they exceed a 1 percent chance of exceeding a certain level. This level of insight allows clients to ascertain areas of peak exposure and consider the applicability of that exposure within their overall portfolio.
Event Response Case Study: US Wildfire Estimation
The importance of good data is becoming even more apparent with the many US wildfires generating significant losses in recent years. These events can have a footprint that is smaller than a zip code yet can drive billions of dollars in losses. Furthermore, we often see properties completely destroyed adjacent to others that are untouched.
Our initial process involves utilizing the fire footprints provided by the fire department and assessing our clients’ exposure. Where clients provide granular resolution data, we try to correlate these risks to properties that have been damaged or destroyed. Pulling all this information together gives us a more complete picture of the event that we are exposed to while also allowing us to benchmark modeling agencies’ assessment of market losses and have meaningful conversations with our clients about their potential losses.
It is clear from the analysis (below) the numerous ways that exposure is a key driver of the risk we face. The improvement in the data that we use to model the risk along with the gains we have seen in recent years means that we are able to have a much clearer understanding of the characteristics of all the assets that we insure. We will continue to improve our data and aim to assess how exposure will change over time. This will include not only improving aspects around data quality but also how populations might change, what impact urbanization will have on exposures along with how assets are distributed to get a fuller picture in terms of how changes in exposure might impact the risk we face from a changing climate.
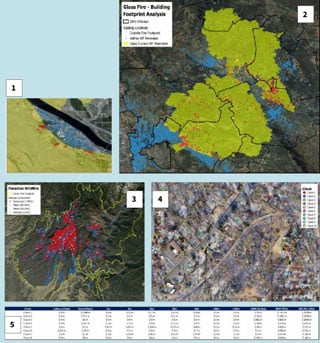
- Property within the fire perimeter adjacent to others that are untouched.
- Size of fire perimeters relative to US Zip Codes.
- Data provided by a California fire department with respect to properties damaged/destroyed.
- Correlating client exposure to properties damaged/destroyed.
- Using proximity to damaged/destroyed properties to ascertain client loss estimates.
Statements of fact and opinions expressed herein are those of the individual authors and are not necessarily those of the Society of Actuaries, the newsletter editors, or the respective authors’ employers.
Mojum Khan has a BSc in Mathematics and Statistics and has been working in the Insurance industry for more than 15 years. Mojum is based in the UK and can be reached at: mojum.khan@axaxl.com.