Term Life Insurance Survey Results
By Carl Friedrich and Sue Saip
Product Matters!, February 2022

In 2021, Milliman conducted its third biennial broad-based survey on term life insurance, capturing historical data for key industry competitors, as well as company perspectives on a range of issues pertaining to these products into the future. The survey covered product and actuarial issues such as sales, profit measures, target surplus, reserves, risk management, underwriting, product design, compensation and pricing. Thirty-four life insurance companies submitted responses.
A summary of the results of the survey is covered in this article, revealing trends in the U.S. individual term life insurance marketplace.
Term Sales
Figure 1 illustrates the level premium term period (LPTP) mix as reported by survey participants from calendar years 2018 through 2020. Term sales were reported for yearly renewable term (YRT), 5-, 10-, 15-, 20-, 25- and 30-year level premium term periods, as well as some sales in other level premium term periods. The market share by level premium term period was fairly stable for term products over the survey period, with the 20-year term at about 41 percent, followed by the 10-year at 21 percent to 23 percent, the 30-year at 14 percent to 16 percent, the 15-year around 10 percent to 12 percent and YRT at about 5 percent. The market share over the survey period primarily shifted from the 10-year term (−2.3 percent) and 15-year term (−1.7 percent) to the 30-year term (+1.8 percent) and other term category (+1.5%).
Figure 1
Level Premium Term Period Mix by Year
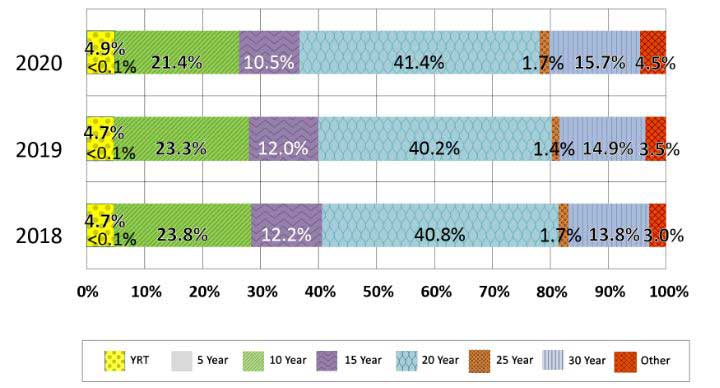
Of the 34 survey participants, 10 reported return of premium (ROP) term sales (included in the total term sales reported above). ROP term sales reported as a percentage of total term sales by all survey participants were 3.8 percent in 2019 and 4.2 percent in 2020. For these 10 participants, ROP term sales as a percentage of their total term sales ranged from 3.5 percent to 28.6 percent in 2019 and from less than 0.1 percent to 59.3 percent in 2020. ROP term sales were reported for 15-, 20-, 25-, 30-year, and other level premium term periods, with the majority in the 20-year and 30-year terms.
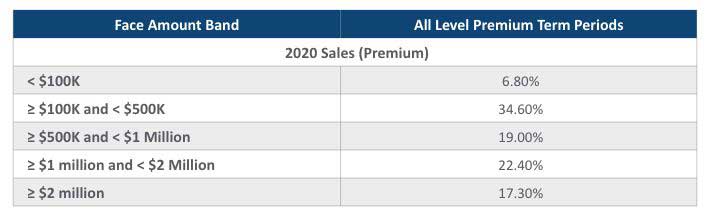
A new question in the survey provides the breakdown of 2020 term sales (premium) by LPTP and face amount band. Table 1 shows this breakdown for all LPTPs combined. The bulk of sales fall in the $100,000 to $2 million face amount range.
Table 1
Distribution of Total Term Sales by Face Amount Band
Total term sales were reported separately by underwriting approach. Underwriting approaches were defined as follows:
- Simplified issue (SI) underwriting. Less than a complete set of medical history questions and no medical or paramedical exam
- Accelerated underwriting (AU). Any fully underwritten life insurance program that allows some applicants to forgo having a medical or paramedical exam and providing fluids, if they meet certain requirements and/or meet certain predetermined thresholds
- Fully underwritten. Complete set of medical history questions and medical or paramedical exam, except where age and amount limits allow for nonmedical underwriting
The distribution of 2020 term sales by underwriting approach based on policy count was 18.3 percent SI, 36.3 percent AU, 44.9 percent fully underwritten, and 0.5 percent other underwriting approaches.
Term sales by application type (paper versus e-app) and issue age range were reported by 25 survey participants based on premium and face amount. For 2020 sales, 19 of the 25 reported sales from both paper and e-apps, one from paper applications only, and the remaining five from e-apps only. Paper applications accounted for 48 percent of total applications (based on premiums) in 2020. On a face amount basis, paper applications accounted for 45 percent in 2020. This compares to 58 percent of applications (premium) and 53 percent (face amount) reported by survey participants in 2019.
Based on 2020 sales by premium, the average issue age for paper application sales was 56 and for e-app sales was 50. Based on sales by face amount, the average issue age for paper application sales was 47 and for e-app sales was 43. The average ages are generally the same as those reported for 2019 sales.
Profit Measures
The predominant profit measure reported by survey participants relative to the pricing of new term sales issued today is an after-tax, after-capital statutory return on investment/internal rate of return (ROI/IRR). The average term ROI/IRR targeted by survey participants was 8.9 percent. Profit margin is also a popular profit metric used by survey participants for term insurance. The average profit margin was 4.8 percent on an after-tax, after-capital basis.
Survey participants reported their actual results for 2020 relative to profit goals. For all term products, 3 percent of participants were exceeding, 44 percent were meeting or close, and 53 percent were short of their profit goals. The primary reason reported for not meeting profit goals in 2020 was higher than targeted expenses.
Reserves
The calculation of deterministic reserves for term insurance must not reflect gains after the LPTP, but any losses after the LPTP must be reflected. Although the deterministic reserve is an aggregate reserve, this requirement around post-level term profits/losses is applied seriatim. Survey participants were asked what approach they are using to satisfy this requirement. Twelve participants referenced calculations at the seriatim level. Four participants lapse all policies at the end of the LPTP, so this issue does not apply to them. Three participants use an aggregate approach and two use a plan-level approach. Other approaches were reported by the final three respondents.
A description of the aggregation of mortality segments for purposes of credibility under Valuation Manual Chapter 20 (VM-20) was provided by 26 of the 34 participants. The majority of participants expect to aggregate mortality segments across broad categories, such as all life products, all permanent products or all fully underwritten products.
Thirty-one participants reported the basis of reserves reflected in term pricing for new term designs under principle-based reserves (PBR). Eighteen of the 31 reported the basis of reserves, 12 reported no new designs were developed, and one reported that PBR is not applicable. Fourteen of the 18 based reserves on the maximum of the net premium reserve (NPR) and the deterministic reserve (DR). Three participants based reserves on the NPR only, and one on the maximum of the NPR, DR, and stochastic reserve (SR).
Risk Management
For new term products under VM-20, 11 participants made changes to their reinsurance structures in light of PBR. Twenty-two participants did not make any changes. One of the 22 noted that it filed for total company exemption. The final participant reported this question is not applicable.
In 2020, the percentage of new term business that was ceded by survey participants ranged from 1 percent to 90 percent, with an average of 47 percent. The median was 50 percent.
The level of reinsurance used for AU term business was reported by 29 of the 34 participants. Four of the remaining five reported that they do not offer AU term business and the fifth did not respond to the question. Seventeen of the 29 participants reported that AU term business is being reinsured consistent with other term business. AU business is being fully retained by eight other participants. The final four participants reported other reinsurance approaches used with AU term business, which suggest the expanded use of reinsurance with these cases.
Underwriting
Of the 32 responses, SI underwriting is being used by 12 participants, AU by 26 participants, full underwriting by 30 participants, and fluidless underwriting by eight participants. Fluidless with substitute information underwriting (fluidless) includes cases that may fail to meet the original AU requirements, but underwriters seek additional or substitute information to avoid paramedical visits with lab tests. Examples of additional or substitute information obtained include attending physician statements (APS), LabpiQture, and electronic medical records (EMR). This underwriting method falls between typical AU and full underwriting approaches. The ages and face amounts where the various underwriting approaches are used vary widely among survey participants.
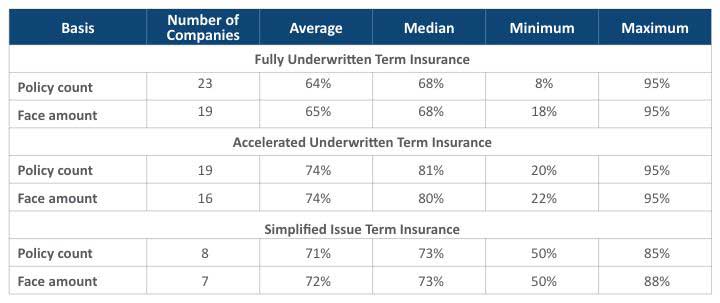
Placement rates (defined as issued policies, excluding not taken policies, and then divided by those policies applied for) for 2020 for fully underwritten, AU, and SI term insurance were reported by 25 survey participants. Responses are summarized in Table 2.
Table 2
Placement Rates
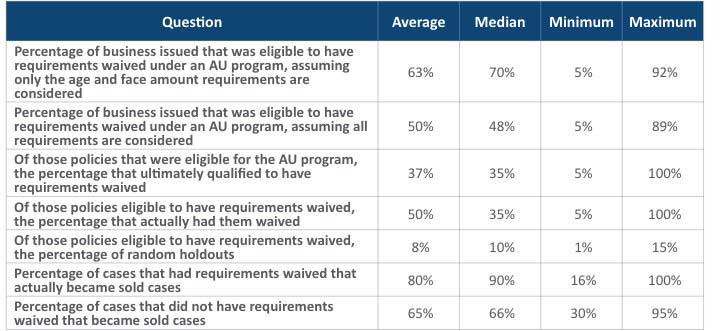
Various statistics on the use of AU were compiled based on survey data relative to new term business issued in 2020. Table 3 includes a summary of the questions and associated statistics (based on policy count). Results are quite variable, as is the experience that survey participants have with their AU programs. Some carriers just started their AU programs in 2021 and others have been using their programs since 2014.
Table 3
Accelerated Underwriting (AU) Experience (Based on Policy Count)
Survey participants reported various ways that they are using to validate that the term insurance AU program is working as expected. The use of random holdouts and post-issue reviews, as well as other approaches, were reported by the 27 participants that responded. Thirteen of the 27 use multiple approaches for validation. Twelve of the 27 include a component of random holdouts in the validation of results. Nineteen of the 27 include a component involving post-issue reviews or audits, with seven of the 27 using post-issue APS’s.
Twenty four companies responded to the question of whether their mortality assumptions vary between accelerated underwriting business and fully underwritten business. Seventeen indicated that they did assume higher mortality for accelerated underwriting, on average 10 percent higher. The other seven companies assume no mortality differences.
Pricing
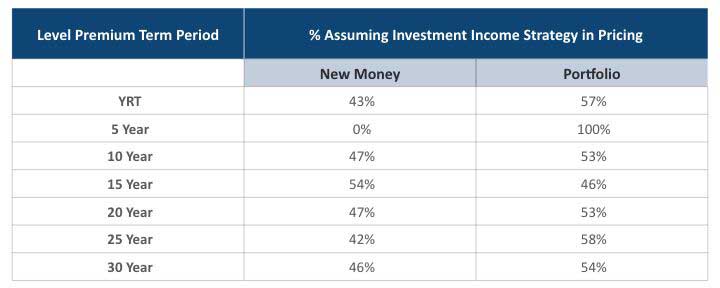
Table 4 shows the split between respondents assuming a new money investment income strategy approach versus a portfolio approach in pricing term products. Overall, 17 of 32 participants assume a portfolio approach and 14 assume a new money approach. The 32nd participant assumes both a new money and portfolio approach for all LPTPs it offers.
Table 4
Term Insurance Investment Income Strategies
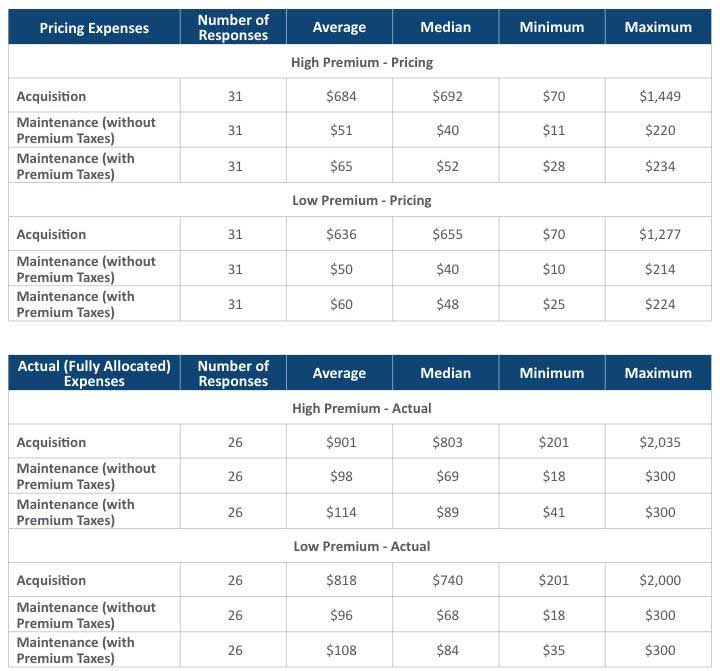
Actual expense levels and those assumed in pricing term products vary widely among survey participants. For comparison purposes, we converted acquisition and maintenance expenses to a dollar amount for a representative sample term policy for each participant. The calculation was done for both pricing expenses and actual (fully allocated) expenses excluding and including premium taxes. We assumed a 20-year level premium term policy with an average face amount of $500,000 issued at age 40, and premiums of $2.00 (high premium) and $1.50 (low premium) per $1,000 of face amount. The tables in Table 5 show statistics relative to dollars of pricing and actual expenses for the representative sample policy.
Table 5
Pricing and Actual Expenses for a Representative Sample Term Policy
Perspectives Looking Forward
As term carriers continue dealing with issues relative to the continued low interest rate environment, elevated mortality due to COVID-19, and the implementation of accelerated underwriting programs and predictive models, it is critical to monitor experience relative to these changes. How will the continued low interest rate environment impact sales? What will emerging mortality experience look like for term products issued under AU programs? Only time will tell.
A complimentary copy of the December 2021 Term Life Insurance Key Discoveries report may be found at https://www.milliman.com/insight/2021-Term-life-insurance-issues.
Statements of fact and opinions expressed herein are those of the individual authors and are not necessarily those of the Society of Actuaries, the editors, or the respective authors’ employers.
Susan J. Saip, FSA, MAAA, is a retired actuary. She can be reached at suesaip@yahoo.com.
Carl Friedrich, FSA, MAAA, is a consulting actuary at Milliman. He can be reached at carl.friedrich@milliman.com.