RILA and VA GMxB U.S. Statutory Reporting Offsets: Implications to Pricing and In-force Management
By Nicholas Carbo, Carson Cook, and David Elliott
Product Matters!, February 2023

Registered Indexed Linked Annuity (RILA) product sales have boomed in recent years due to an attractive proposition of upside crediting potential combined with market protection (see Figure 1). RILA offers many benefits to insurers including expanding their annuity suite to meet the needs of clients with different risk tolerance levels.
Due to the potential for a policyholder to lose money, RILA products are classified as Variable Annuity (VA) products and therefore subject to VA nonforfeiture law, VM-21, and C3 Phase 2. This results in a unique opportunity for insurers to aggregate blocks of RILA and VA with guaranteed minimum benefits (VA GMxB) for the purpose of U.S. statutory reserve and capital calculations. This article highlights the impacts to reserves and capital due to offsetting risks when aggregating RILA and VA GMxB along with the implications to capital planning and pricing.
Figure 1
2015–2022 Deferred Annuity Sales ($B)
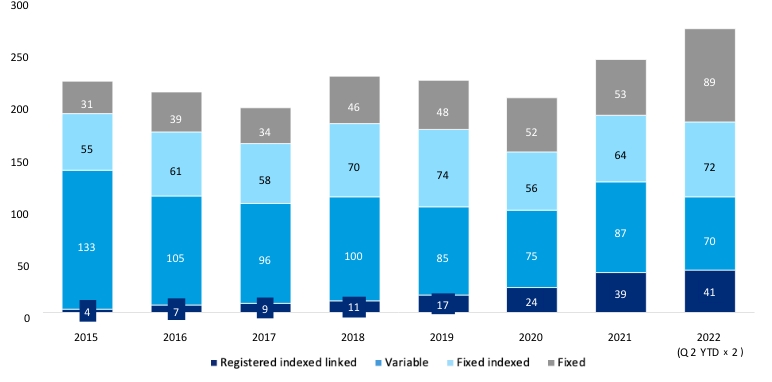
Source: LIMRA LOMA U.S. Individual Annuity Sales Study
RILA Product Overview
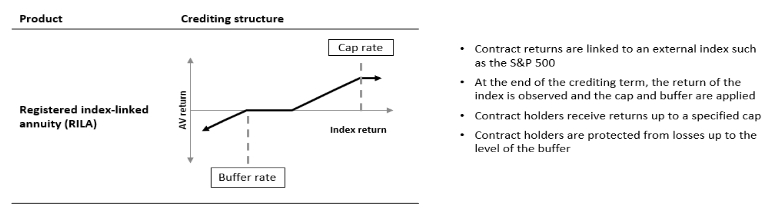
RILA products credit interest to the contract holder accounts based on a combination of an external index, crediting method, and crediting term. The following terms are important for understanding RILA crediting (see Figure 2):
- Cap: Maximum amount of interest that can be credited at the end of a crediting term
- Buffer: Amount of loss the insurance company absorbs if the index decreases in value; losses more than the buffer will reduce the contract value
- Crediting term: Length of time over which index performance is measured; crediting terms are typically between 1 and 6 years
Figure 2
RILA cap with buffer design
VA Product Overview
VA products are held in separate accounts allowing contract holders to select a variety of unit funds, primarily invested in stocks and bonds. Separate accounts do not provide protection against loss.
To protect against the uncertainty in returns, VA writers may offer GMxB riders for an additional fee. The three main types of “guaranteed” riders are:
- GMAB: Guaranteed minimum accumulation benefit
- Future contract value subject to stated minimum
- GMIB: Guaranteed minimum income benefit
- Lifetime income based on annuitization of a defined benefit base
- GMWB: Guaranteed minimum withdrawal benefit
- Annual withdrawal amounts for the lifetime of the annuitant(s) regardless of market performance
Reserve and Capital Impacts
Two potential offsets exist when combining RILA and VA GMxB blocks:
- Point-in-time reserve and capital diversification
- Offsetting equity exposures
Point-in-time reserve and capital diversification benefits are realized when aggregating RILA and VA GMxB blocks within scenario reserve calculations. VM-21 reserves and C3 Phase 2 capital are calculated using CTE 70 (average of worst 30% of scenario reserves) and CTE 98 (average of worst 2% of scenario reserves) respectively. Aggregating RILA and VA GMxB blocks in CTE calculations can provide an offset relative to standalone calculations because:
- Worst scenarios may be different between RILA and VA GMxB
- RILA scenario reserves may be less than cash surrender value (CSV), even for tail VA GMxB scenarios, which are floored on a standalone basis
RILA and VA GMxB blocks provide offsetting equity exposures when aggregated due to the design of the products. This offset is highlighted in the following two cases shown in Table 1:
Table 1
RILA and VA GMxB offsetting equity exposures
| Equity performance |
RILA |
VA GMxB |
|
Positive |
Liability increases due to positive index credits |
Liability decreases due to lower expected rider claims |
|
Negative |
Liability decreases due to negative index credits |
Liability increases due to higher expected rider claims |
RILA writers can leverage the offsetting equity exposures by combining RILA and VA hedging. RILA writers that do not combine their RILA and VA hedge programs may still see the offsetting equity exposures in the U.S. statutory reserve and capital CTE adjusted runs. Although the combination of RILA and VA hedge programs is outside the scope of this article, the offsetting equity exposure is explored through the CTE adjusted runs in the section below.
VM-21 & C3 Phase 2 Definitions
Scenario reserves:Assets needed such that there are no future accumulated deficiencies, floored at CSV
CTE X (adjusted)[1]:
Average of the highest (100-X) % of scenario reserves ignoring the impact of future hedges
CTE X (best efforts):
Average of the highest (100-X) % of scenario reserves reflecting the impact of future hedges
Additional standard projection amount (ASPA):
Additional reserve held in some cases when prescribed assumptions are more conservative than company assumptions
Error factor (E):
Ranges from 5% to 100%
Stochastic reserve (SR):
CTE 70 (best efforts) + E x max [0, CTE 70 (adjusted) – CTE 70 (best efforts)]
VM-21 reserve:
SR + ASPA
C3 Phase 2 amount[2]:
25% x (CTE 98 (best efforts) + E x max [0, CTE 98 (adjusted) – CTE 98 (best efforts)] + ASPA – VM-21 reserve) x (1 – federal income tax rate)
Total asset requirement (TAR):
VM-21 reserve + C3 Phase 2 amount
[1] Some RILA writers reflect the hedging of RILA index credits in the CTE (adjusted) runs
[2] Assumes U.S. statutory reserve is equal to the tax reserve
Illustrative Analysis
To demonstrate the potential offsets of RILA and VA GMxB aggregation, reserve and capital analysis are shown based on sample RILA and VA products (see Table 2).
Table 2
Sample product designs
| RILA |
VA |
Other modeling considerations |
|
Term length: 1 year |
GMxB rider: GMWB |
RILA hedging: Static |
* Solved to maintain level pricing spread based on the economic environment
The Total Asset Requirement in excess of cash surrender value is summarized in Tables 3 and 4. Results vary by the following factors:
- Standalone for each of RILA and VA GMxB and aggregate for both RILA and VA GMxB
- Amount of RILA account value
- Reflecting inclusion and exclusion of future RILA index hedge credits in adjusted runs
RILA Future Index Credit Hedging in the VM-21 Adjusted Runs
For RILA writers that hedge index credits with a static hedge, the practice of including or excluding future index hedge credits in the VM-21 adjusted runs varies by company. According to the 2022 Oliver Wyman RILA Survey, 80% of participants reflect the hedging of future index credits in the adjusted run (see Figure 3).
Figure 3: Adjusted Run Future RILA Index Hedges

Table 3
Total asset requirement in excess of CSV*: reflects future RILA index hedging in adjusted run
$millions, except RILA contract value
| RILA CV |
TAR-CSV: RILA |
TAR-CSV: VA GMxB |
Sum |
Aggregate |
Impact of aggregation |
|
$0 |
0 |
503 |
503 |
503 |
0 |
|
$1B |
6 |
503 |
509 |
487 |
(22) |
|
$2B |
13 |
503 |
516 |
472 |
(44) |
|
$3B |
19 |
503 |
522 |
460 |
(62) |
|
$4B |
26 |
503 |
529 |
449 |
(80) |
|
$5B |
32 |
503 |
535 |
439 |
(96) |
|
$7.5B |
48 |
503 |
551 |
418 |
(133) |
|
$10B |
64 |
503 |
567 |
400 |
(167) |
|
$15B |
97 |
503 |
600 |
378 |
(222) |
|
$20B |
129 |
503 |
632 |
384 |
(248) |
* Values based on sample products and can vary greatly by product design, economic environment, etc.
Table 4
Total asset requirement in excess of CSV*: Ignores future RILA index hedging in adjusted run
$millions, except RILA contract value
| RILA CV |
TAR-CSV: RILA |
TAR-CSV: VA GMxB |
Sum |
Aggregate |
Impact of aggregation |
|
$0 |
0 |
503 |
503 |
503 |
0 |
|
$1B |
64 |
503 |
567 |
483 |
(84) |
|
$2B |
128 |
503 |
631 |
465 |
(166) |
|
$3B |
192 |
503 |
695 |
451 |
(244) |
|
$4B |
255 |
503 |
758 |
462 |
(296) |
|
$5B |
319 |
503 |
822 |
494 |
(328) |
|
$7.5B |
479 |
503 |
982 |
607 |
(375) |
|
$10B |
639 |
503 |
1,142 |
732 |
(410) |
|
$15B |
958 |
503 |
1,461 |
999 |
(462) |
|
$20B |
1,277 |
503 |
1,780 |
1,292 |
(488) |
* Values based on sample products and can vary greatly by product design, economic environment, etc.
Key Takeaways
Aggregating RILA and VA GMxB blocks results in a lower TAR in excess of CSV than on a standalone basis, as a result of point-in-time reserve and capital diversification and offsetting equity exposures.
Offsets are larger when excluding future RILA index hedging in the adjusted run. The point-in-time reserve and capital diversification is realized regardless, while the additional offset as a result of offsetting equity exposures is also realized when future RILA index hedging is excluded.
Aggregated RILA and VA GMxB TAR in excess of CSV is lower when excluding future RILA index hedges in the adjusted run when RILA CV is $3 billion or less and lower when including future RILA index hedges in the adjusted run when RILA CV is $4 billion or more.
As the RILA total CV increases, the aggregated TAR in excess of CSV declines until an inflection point when it begins to increase, as follows:
- When reflecting future RILA index hedges, the excess increases once RILA CV exceeds $15 billion
- When excluding future RILA index hedges, the excess increases when RILA CV exceeds $3 billion
The latter is driven by the unhedged CTE adjusted run spiking after RILA CV exceeds $3 billion (see Figure 4). For the sample products, this trend suggests the offsetting equity exposure is optimized when RILA CV is 30% of VA CV.
Figure 4
CTE 98 (adjusted) aggregated asset requirement in excess of CSV*: Ignores future RILA index hedging ($10B of VA CV)
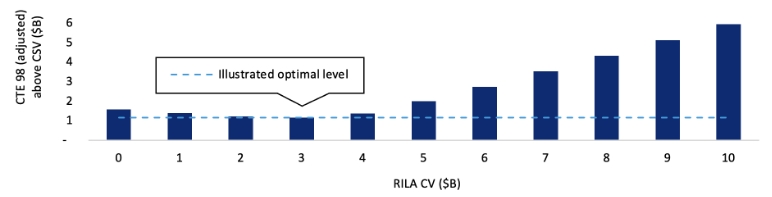
* Values based on sample products and can vary greatly by product design, economic environment, etc.
Capital Management Considerations
Capital will fluctuate over time as the scale of RILA and VA GMxB blocks change. RILA writers should project out the aggregation offset to understand future capital dynamics under various economic conditions and sensitivities to policyholder behavior assumptions (e.g., lapses).
RILA lapsation could lead to increases in capital if lapses are higher than assumed in the scenario reserve calculations. This increase could particularly come into play in the RILA shock lapse period. Shock lapse experience for RILA products is currently limited. If the actual shock lapse is greater than assumed, a spike in TAR could occur due to a lower aggregation offset than projected. RILA writers should sensitivity test their RILA shock lapse assumption to assess the impact of a large shock lapse.
M&A and Reinsurance Implications
As VA GMxB blocks have matured, mergers and acquisitions (M&A) and reinsurance transactions have become very common. The presence of a RILA block could impact transactions for divesting and acquiring these blocks. Values from Table 3 with a $1 billion RILA block are used to illustrate potential impacts. The following considers a transaction in which the writer of both VA GMxB and RILA is looking to sell their VA GMxB block to a buyer with neither VA GMxB nor RILA.
The transaction will have implications for both parties, Table 5. The seller will retain $6 million of TAR in excess of CSV while the buyer will be responsible for $503 million of TAR in excess of CSV. If all supporting assets are transferred, the buyer would need an additional $16 million of funding. The seller would need to post an additional $6 million of capital for the standalone RILA capital requirement.
Table 5
Total asset requirement in excess of CSV ($M): Seller has RILA but the buyer does not
| Pre-transaction |
Post-transaction |
Additional funding |
|||
|
Seller |
Seller |
Buyer |
Seller |
Buyer |
Total |
|
487 |
6 |
503 |
6 |
16 |
22 |
A buyer with an existing RILA block could be positioned with a more competitive bid to help win the VA GMxB block. In the example above, if the buyer had a RILA block, and the seller did not, then the buyer would realize the $22 million aggregation offset when acquiring the block, which could be factored into the price offered.
Pricing Impacts
Many RILA writers reflect the reserve and capital diversification in evaluating profitability for their RILA products. According to an Oliver Wyman survey (as of March 2022) Figure 5, 46% of participants included VA GMxB / RILA diversification in RILA pricing. Common ways that pricing teams reflect the benefit is through either holding zero C3 Phase 2 capital or applying a percentage reduction to reserve and capital values, subject to a capital floor.
Reflecting these benefits in VA GMxB pricing is less common because these blocks typically dominate the reserve and capital calculations.
Figure 5: Aggregation offset in RILA pricing

If reflecting aggregation offsets in pricing, RILA writers should be aware that capital offsets from RILA may decrease as more RILA is issued relative to VA GMxB. Figure 6 shows the incremental change to aggregate TAR in excess of CSV for each additional $1 billion of RILA sales added, based on the data used in Table 3.
Figure 6
Incremental capital benefit: varying level of RILA CV and $10B of VA CV

* Values based on sample products and can vary greatly by product design, economic environment, etc.
Key Considerations
RILA and VA GMxB aggregation benefits from point-in-time reserve and capital diversification and the offsetting equity exposures between RILA and VA GMxB products. The offsets can vary over time, so RILA writers should ensure their capital planning team is aware of potential capital fluctuations. Below are a few areas that should be analyzed:
- Changes to RILA sales levels
- RILA shock lapse assumptions
- VA GMxB block runs off slower or faster than expected
- M&A and reinsurance implications
RILA writers should consider how to reflect the offsets in pricing and answer the following questions:
- How / if the aggregation offset is reflected in pricing? If so, will the offset be reflected in RILA, VA GMxB, or both?
- Should the benefit grade off over time? If so, how do you determine the grade off approach?
- How should the offset be reflected for different levels of RILA sales?
Regardless of the pricing approach, when evaluating profitability RILA writers should periodically assess reasonability by comparing to the actual offset realized.
Statements of fact and opinions expressed herein are those of the individual authors and are not necessarily those of the Society of Actuaries, the editors, or the respective authors’ employers.
Nicholas Carbo, FSA, MAAA, is a Senior Principal with the Actuarial Practice of Oliver Wyman. He can be reached at nicholas.carbo@OliverWyman.com.
Carson Cook, FSA, MAAA, is a Manager with the Actuarial Practice of Oliver Wyman. He can be reached at carson.cook@oliverwyman.com.
David Elliott, FSA, CERA, MAAA, is a Senior Manager with the Actuarial Practice of Oliver Wyman. He can be reached at david.elliott@oliverwyman.com.