Results of Universal Life, Indexed Universal Life, and Variable Universal Life Survey
By Susan J. Saip
Product Matters!, August 2021

The 14th annual comprehensive survey addressing universal life (UL), indexed UL (IUL), and variable UL (VUL) issues was recently completed by Milliman. UL/IUL/VUL products have played a significant role in the individual life insurance market for many years. In the last 10 years, the market share of these UL-type products combined has consistently been in the range of 41% to 47% [1] of total life sales measured by first-year premium. Survey results are based on responses from 28 carriers of UL, IUL, and VUL products. (Note: The scope of the survey was expanded in 2020 to include VUL products.) The survey covers a range of specific product and actuarial issues such as sales, profit measures, target surplus, reserves, risk management, investments, underwriting, product design, compensation, pricing, and illustrations.
The following products (as defined here) are included in the scope of the survey:
- UL/IUL with secondary guarantees (ULSG/IULSG). A UL/IUL product designed specifically for the death benefit guarantee market that features long-term no-lapse guarantees (guaranteed to last until at least age 90) either through a rider or as a part of the base policy.
- Cash accumulation UL/IUL (AccumUL/AccumIUL). A UL/IUL product designed specifically for the accumulation-oriented market, where efficient accumulation of cash values to be available for distribution is the primary concern of the buyer. Within this category are products that allow for high early cash value accumulation, typically through the election of an accelerated cash value rider.
- Current assumption UL/IUL (CAUL/CAIUL). A UL/IUL product designed to offer the lowest-cost death benefit coverage without secondary death benefit guarantees. Within this category are products sometimes referred to as “dollar-solve” or “term alternative.”
- Variable universal life (VUL). A UL product that is registered with the Securities and Exchange Commission (SEC) with cash values that fluctuate depending on investment performance.
Throughout this article, the use of the term UL is assumed to exclude IUL and VUL.
Input from survey participants related to the UL/IUL/VUL environment in late 2020. Data does not reflect the current interest rate environment. The key discoveries of the survey are highlighted in this article.
Overall Sales
Survey participants reported sales for calendar years 2018, 2019, and for 2020 as of Sept. 30, 2020 (YTD 9/30/20). Unless noted otherwise, throughout this report sales were defined as the sum of recurring premiums plus 10 percent of single premiums for purposes of the survey. UL sales during YTD 9/30/20 accounted for 28% of total UL/IUL/VUL sales combined (reported by survey participants) during YTD 9/30/20, decreasing from the 37% of total sales it represented in 2018. IUL sales during YTD 9/30/20 accounted for 61% of total UL/IUL/VUL sales combined, increasing from the 54% of total sales it represented in 2018. VUL sales during YTD 9/30/20 accounted for 11% of total UL/IUL/VUL sales combined, increasing from the 9% of total sales it represented in 2018. Sales in 2020 were likely impacted by the low interest rate environment, as well as challenges triggered by the pandemic. This was especially true for UL sales and, to a lesser extent, for IUL sales.
Of the 28 survey participants, 13 reported UL, IUL, and VUL sales, five reported UL and IUL sales, four reported UL sales only, another four reported IUL sales only, and two reported UL and VUL sales.
The following three sections include further details about UL, IUL, and VUL sales separately.
UL Sales
Figure 1 illustrates the product mix of UL sales reported by 26 of the 30 survey participants for calendar years 2017 and 2018, and for year-to-date (YTD) 2019 as of Sept. 30, 2019 (YTD 9/30/19).
Figure 1
UL Product Mix by Year
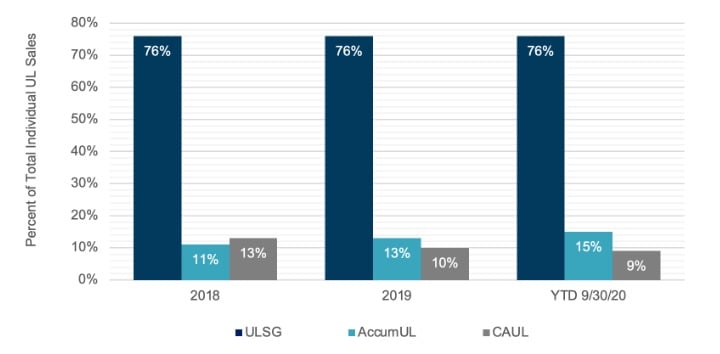
Abbreviations: AccumUL, cash accumulation universal life; CAUL, current assumption universal life; ULSG, universal life with secondary guarantees; YTD, year to date.
Figure 2 shows the number of participants issuing each UL product type during the survey period. AccumUL had the highest number of companies issuing policies in 2018 and 2019, and ULSG had the highest in YTD 9/30/20.
Figure 2
Number of Participants Issuing UL Products
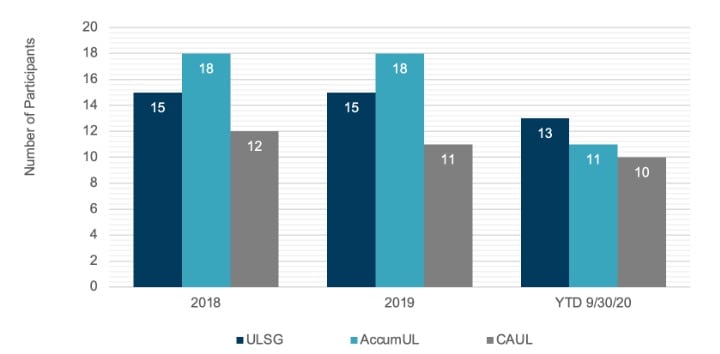
Abbreviations: AccumUL, cash accumulation universal life; CAUL, current assumption universal life; ULSG, universal life with secondary guarantees; YTD, year to date.
Annualized 2020 sales were calculated based on YTD 9/30/20 sales and the distribution of 2019 sales (by quarter) that survey participants reported. Sales have declined year-over-year (YOY) over the survey period (based on annualized YTD 9/30/20 sales) for total individual UL, ULSG, and CAUL. For AccumUL, sales decreased from 2018 to 2019, but increased when comparing 2019 sales to annualized YTD 9/30/20 sales. The increase occurred despite seven participants exiting the AccumUL market. (Increases in AccumUL sales were reported from 2019 to YTD 9/30/20 by six of the remaining 11 participants.)
Total individual UL sales were reported by 20 participants based on the underwriting approach for 2019 and YTD 9/30/20. For the purpose of the survey, underwriting approach was defined as follows:
- Simplified issue (SI) underwriting. Less than a complete set of medical history questions and no medical or paramedical exam.
- Accelerated underwriting (AU). The use of tools such as a predictive model to waive requirements such as fluids and a paramedical exam on an otherwise fully underwritten product for qualifying applicants without charging a higher premium than for fully underwritten business.
- Fully underwritten. Complete set of medical history questions and medical or paramedical exam, except where age and amount limits allow for nonmedical underwriting.
The distribution of 2019 UL sales (on a policy count basis) by underwriting approach was 24.3% SI, 14.2% AU, 61.3% fully underwritten, and 0.2% other underwriting approaches. For YTD 9/30/20 UL sales, the distribution by underwriting approach was 22.2% SI, 19.0% AU, 59.8% fully underwritten, and 0.1% other underwriting approaches. The portion of AU business is greater than what was reported in the previous UL/IUL survey for calendar year 2018 and YTD 9/30/19 (likely due to the mix of participating companies). We believe that SI and AU are more commonly used on term insurance plans than UL, IUL, or VUL.
UL sales by application type (paper versus e-app) and issue age range were reported by 16 survey participants on a premium and face amount basis. For 2019 sales, 11 of the 16 participants reported sales from both paper applications and e-apps, four from paper applications only, and the remaining one from e-apps only. One participant that reported sales from paper applications only in 2019, reported sales from both paper and e-apps in YTD 9/30/20. Therefore, for YTD 9/30/20 sales, 12 of the 16 reported sales from both paper and e-apps, three from paper applications only, and the remaining one from e-apps only. Paper applications accounted for 82% of total applications (based on premiums) for both 2019 and YTD 9/30/20. On a face amount basis, paper applications accounted for 71% of total applications for 2019 and 46% in YTD 9/30/20.
Based on 2019 and YTD 9/30/20 sales by premium, the average issue age for paper application sales was 59 and for e-app sales was 55. Based on sales by face amount, for 2019 the average issue age for paper application sales was 54 and for e-app sales was 46. These averages are significantly lower than the averages determined based on premium. Based on YTD 9/30/20 sales by face amount, the average issue age for paper application sales was 54 and for e-app sales was 47. The average age is the same as that reported for paper applications sales in 2019. The average age for e-apps is one year older than the average reported in 2019 for e-apps.
Indexed UL Sales
Of the 28 survey participants, 22 reported IUL sales. The AccumIUL sales percentage increased from 89% in 2018 to 91% of AccumUL/AccumIUL combined sales in YTD 9/30/20. IULSG sales also increased, from 13% to 21% of ULSG/IULSG combined sales, over the survey period. The CAIUL sales percentage increased from 35% in 2018 to 56% of CAUL/CAIUL combined sales in YTD 9/30/20.
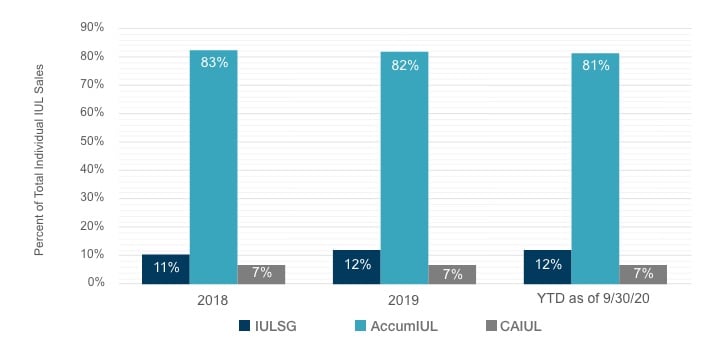
Sales of AccumIUL products continued to dominate the IUL market throughout the survey period. Figure 3 shows the market share for AccumIUL decreased slightly from 2018 to 2019 and also from 2019 to YTD 9/30/20. The market share for IULSG increased from 2018 to 2019 and remained stable during YTD 9/30/20. For CAIUL, the market share was stable throughout the survey period.
Figure 3
IUL Product Mix by Year
The distribution of 2019 IUL sales (on a policy count basis) by underwriting approach was 0.3% SI, 4.2% AU, 95.0% fully underwritten, and 0.5% other underwriting approaches. For YTD 9/30/20 IUL sales, the distribution by underwriting approach was 3.3% SI, 4.2% AU, 92.1% fully underwritten, and 0.4% other underwriting approaches. From 2019 to YTD 9/30/20, overall, there was a shift to SI from fully underwritten sales. The portion of IUL sales subject to SI was 19% to 24% lower than reported for UL sales. The portion of IUL sales subject to AU was about 10% to 15% lower than that reported for UL sales. The portion of AU business may appear surprisingly low and is lower than what was reported in the previous UL/IUL survey for calendar year 2019 and YTD 9/30/20 (due to the significant reduction of AU sales reported by one participant).
IUL sales by application type (paper versus e-app) and issue age range were reported by 14 survey participants on both a premium and face amount basis for 2019 and YTD 9/30/20. Eleven of the 14 reported sales from both paper applications and e-apps and two from paper applications only in 2019 and YTD 9/30/20. One participant reported sales from paper applications only in 2019 and from both paper and e-apps in YTD 9/30/20. Paper applications accounted for 66% of total applications (based on premiums) and 54% of total applications (based on face amount) for 2019. For YTD 9/30/20, paper applications accounted for 56% of total applications (based on premiums) and 43% of total applications (based on face amount). The use of e-apps is more common for IUL business than for UL business.
Based on 2019 sales by premium, the average issue age for paper application sales was 52 and for e-app sales was 46. For YTD 9/30/20 sales by premium, the average age for paper applications was 51 and for e-app sales was 45. Based on 2019 sales by face amount, the average issue age for paper applications was 46 and for e-app sales was 38. For YTD 9/30/20 sales by face amount, the average age is one year younger than that reported in 2019 for paper applications and one year older than that reported in 2019 for e-apps.
Variable UL Sales
The scope of the survey was expanded in 2020 to include VUL products. Of the 28 survey participants, 15 reported VUL sales. Total individual VUL sales increased steadily over the survey period.
VUL sales were reported by 10 participants based on the underwriting approach. The distribution of 2019 VUL sales (on a policy count basis) by underwriting approach was 0.4% SI, 4.1% AU, 95.4% fully underwritten, and less than 1.0% for other underwriting approaches. For YTD 9/30/20 VUL sales, the distribution by underwriting approach was 0.3% SI, 18.5% AU, 81.2% fully underwritten, and less than 1.0% other underwriting approaches. From 2019 to YTD 9/30/20, overall, there was a shift from fully underwritten to AU sales. The portion of 2019 VUL sales subject to SI and AU was similar to that reported for IUL sales in 2019. In YTD 9/30/20, the portion of VUL sales subject to AU was similar to that reported for UL sales. One of the top VUL participants (in terms of sales) reported 32% of its VUL policies were issued using AU, which may be driving this result.
VUL sales by application type (paper versus e-app) and issue age range were reported by seven survey participants on both a premium and face amount basis. In 2019, two of the seven reported sales from both paper applications and e-apps and five from paper applications only. In YTD 9/30/20, three of the seven reported sales from both paper applications and e-apps, and four from paper applications only. Paper applications accounted for 89% to 90% of total applications (based on premiums) for 2019 and YTD 9/30/20. On a face amount basis, paper applications accounted for 85% of total applications for 2019 and 84% in YTD 9/30/20. The use of paper applications is more prevalent for VUL business than for UL and IUL business. (Two participants that use paper applications only for VUL business, use both paper and e-apps for UL and IUL business.)
Based on 2019 sales by premium, the average issue age for paper application sales was 50 and for e-app sales was also 50. For YTD 9/30/20 sales by premium, the average age for e-app sales is the same as that reported in 2019, but the average age for paper application sales is two years younger than that reported in 2019. Based on 2019 sales by face amount, the average issue age for paper applications was 44 and for e-app sales was 41. For YTD 9/30/20 sales by face amount, the average age is the same as that reported for e-app sales in 2019 but is two years younger than the average reported for paper applications in 2019.
Living Benefit Rider Sales
Chronic Illness Accelerated Death Benefit (ADB) Riders
There are three common approaches to chronic illness ADB riders: the discounted death benefit approach, the lien approach and the dollar-for-dollar approach. The dollar-for-dollar approach includes an explicit premium, but the other approaches do not. Definitions of the various approaches are as follows:
- Discounted death benefit approach. The insurer pays the owner a discounted percentage of the face amount reduction, with the face amount reduction occurring at the same time as the accelerated benefit payment. This approach avoids the need for charges up front or other premium requirements for the rider, because the insurer covers its costs of early payment of the death benefit via a discount factor.
- Lien approach. The payment of accelerated death benefits is considered a lien or offset against the death benefit. Access to the cash value (CV) is restricted to any excess of the CV over the sum of the lien and any other outstanding policy loans. Future premiums and charges for the coverage are unaffected, and the gross policy values continue to grow as if the lien did not exist. In most cases, lien interest charges are assessed under this design.
- Dollar-for-dollar approach. There is a dollar-for-dollar reduction in the specified amount or face amount of the base plan and a pro rata reduction in the CV based on the percentage of the specified amount or face amount that was accelerated.
Of the 24 participants reporting UL sales, 16 reported UL sales with chronic illness ADB riders. Fifteen of the 22 IUL survey participants reported IUL sales with chronic illness ADB riders. Thirteen of the 15 also reported UL sales with chronic illness riders.
Figure 4 summarizes sales of chronic illness riders as a percentage of total sales by premium (separately for UL and IUL products). During YTD 9/30/20, sales of chronic illness riders as a percentage of total sales were 7.7% for UL products and 46.3% for IUL products. The difference may be driven by the high percentage of UL policies that are written with long-term care (LTC) riders (see Figure 5). A chronic illness rider would not also be included on those policies.
Figure 4
Chronic Illness Rider Sales as a Percentage of Total Sales
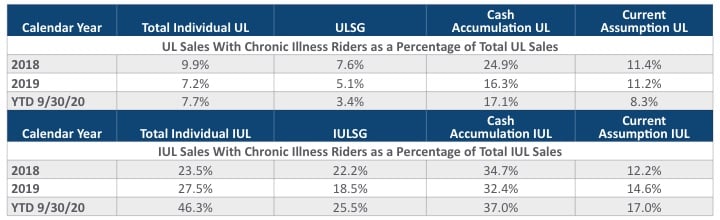
Abbreviations: IUL, indexed universal life; IULSG, indexed universal life with secondary guarantees; UL, universal life; ULSG, universal life with secondary guarantees; YTD, year to date.
Eight of 18 participants that reported UL/IUL sales with chronic illness riders provide a discounted death benefit as an accelerated benefit. Five of these eight participants automatically include chronic illness riders with the base UL/IUL policy. Six participants reported their chronic illness riders use a lien against the death benefit to provide the accelerated benefit. Two of the six automatically include the chronic illness riders. Another three use a dollar-for-dollar discounted death benefit reduction approach. The final three participants use both the discounted death benefit approach and the dollar-for-dollar death benefit reduction approach.
Long-Term Care (LTC) Riders
Of the 24 survey participants reporting UL sales, eight reported UL sales with long-term care (LTC) riders. Four participants reported sales with an LTC ADB rider only. Another four participants reported sales of an LTC ADB rider, an extension of benefits rider (EBR), and an inflation protection rider (IPR). Similarly, of the 22 survey participants reporting IUL sales, 10 reported IUL sales with long-term care (LTC) riders. Nine of the 10 participants reported IUL sales with an LTC ADB rider only (none with EBR or IPR). The 10th participant reported sales with an LTC ADB rider and EBR rider. (Note that other participants that offer EBR and IPR riders did not report sales here.)
Figure 5 shows sales of LTC riders as a percentage of total sales (measured by premiums and weighting single-premium sales at 10%) for UL and IUL products separately by product type. During YTD 9/30/20, sales of policies with LTC riders as a percentage of total sales by premium were 66.1% for UL products and 10.3% for IUL products. It is notable that over half of UL sales by premium include an LTC rider. Also, most of those sales include EBRs and IPRs.
Figure 5
LTC Rider Sales as a Percentage of Total Sales by Premium
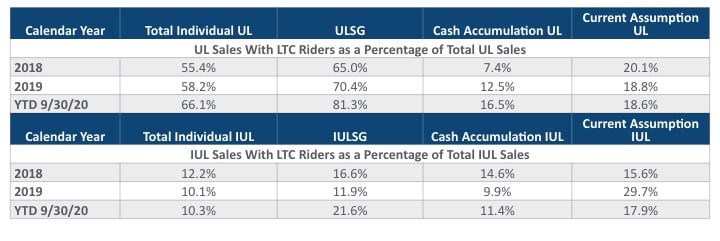
Abbreviations: IUL, indexed universal life; IULSG, indexed universal life with secondary guarantees; UL, universal life; ULSG, universal life with secondary guarantees; YTD, year to date.
Drivers of UL/IUL/VUL Profitability
The UL/IUL/VUL survey included information about the following key drivers of the pricing of these products:
- profit measures and targets,
- target surplus,
- reserves,
- reinsurance,
- investment yields and
- expenses
Profit Measures and Targets
The predominant profit measure reported by survey participants continues to be an after-tax, after-capital statutory return on investment/internal rate of return (ROI/IRR). The median targeted ROI/IRR reported is 10.0% for each of AccumUL, CAUL, IULSG, AccumIUL, and VUL, 9.0% for ULSG, and 11.3% for CAIUL.
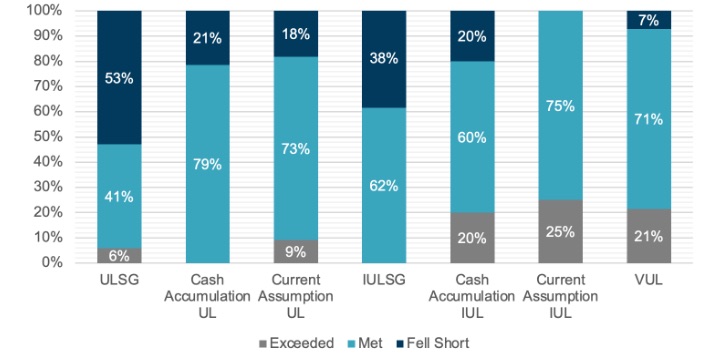
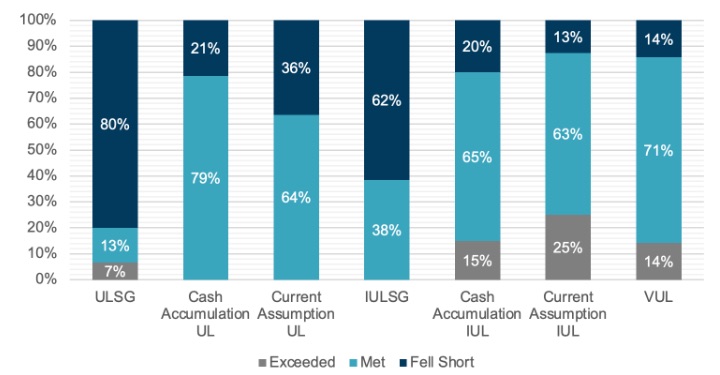
Figures 6 and 7 show the percentage of survey participants reporting that they fell short of, met, or exceeded their profit goals by UL/IUL/VUL product type, for calendar year 2019 and YTD 9/30/20, respectively. Of note is the percentage of participants that fell short of their profit goals for ULSG products: 44 percent in 2019 and 50 percent during YTD 9/30/20. The primary reasons reported for not meeting profit goals were lower interest earnings and higher expenses.
Figure 6
Actual Results Relative to Profit Goals for 2019
Abbreviations: IUL, indexed universal life; IULSG, indexed universal life with secondary guarantees; UL, universal life; ULSG, universal life with secondary guarantees; VUL, variable universal life.
Figure 7
Actual Results Relative to Profit Goals for YTD 9/30/20
Abbreviations: IUL, indexed universal life; IULSG, indexed universal life with secondary guarantees; UL, universal life; ULSG, universal life with secondary guarantees; VUL, variable universal life; YTD, year to date.
Target Surplus
The majority of survey participants continue to set target surplus pricing assumptions for UL/IUL/VUL products as a percentage of the National Association of Insurance Commissioners (NAIC) company action level. The overall NAIC risk-based capital (RBC) percentage of company action level ranged from 250% to 510%.
Reserves
Various questions were included in the survey relative to principle-based reserves (PBR) in accordance with the Valuation Manual Chapter 20 (VM-20).
The majority of survey participants are not using the stochastic exclusion test (SET). The SET is a means of determining if the added effort of calculating stochastic reserves under PBR is required. Of 28 responses, 19 are not using the test, have not analyzed the test, or PBR does not apply to them. Eight participants are using the ratio test for this aspect of VM-20 relative to UL/IUL/VUL products. One participant is using the certification option. Six of the eight participants using the SET indicated that the SET results are consistent both pre-reinsurance and post-reinsurance. One participant noted that the results are not consistent, and the final participant did not respond.
Eleven survey participants reported they are explicitly modeling the deterministic reserve (DR) and stochastic reserve (SR) in pricing projections (i.e., projecting these reserve components). An additional eight participants are explicitly modeling the DR, but not the SR. Six reported they are not explicitly modeling either the DR or SR in pricing projections. It is possible they passed both the deterministic exclusion test (DET) and SET. The remaining three participants either did not respond or indicated that the question is not applicable.
A variety of responses were received from 21 survey participants relative to how the company is reflecting reinsurance in the DR/SR for yearly renewable term (YRT) deals, and separately, for coinsurance deals. Few details were reported for coinsurance deals. Approaches for YRT reinsurance included not reflecting reinsurance, taking the ½ Cx reserve credit for YRT deals, using prudent estimates for reinsurer actions, adjusting YRT rates consistent with projected mortality, modeling expected experience with a margin on the YRT premium, and treating reinsurance as a cash flow item in the cash flows in pricing. Also, one participant reported that it has the ceded reserve for the DR/SR equal to the ceded reserve for the net premium reserve (NPR) and no reinsurance cash flows were modeled for 2020.
Many survey participants are struggling with challenges presented by forecasting the deterministic and stochastic reserves. Difficulties were reported with run times, scenarios, modeling and assumptions.
Survey participants provided responses relative to the aggregation of mortality segments for determining credibility for UL/IUL/VUL products. The Valuation Manual defines a mortality segment as “a subset of policies for which a separate mortality table representing the prudent estimate mortality assumption will be determined.” Most participants expect to aggregate mortality segments across broad categories, such as all life products, all permanent products or all fully underwritten products.
Reinsurance
Survey participants reported that retention limits on UL/IUL/VUL business ranged from $500,000 up to $30 million, with a median limit of $5 million and an average of about $7.4 million.
Nineteen participants reported the level of reinsurance used for AU UL/IUL/VUL business. Eleven of the 19 participants reported that AU UL/IUL/VUL business is being reinsured consistent with other UL/IUL/VUL business. AU business is being fully retained by three other participants. The final five participants reported other reinsurance approaches used with AU UL/IUL/VUL business, with two of the five reporting approaches that suggest the expanded use of reinsurance with these cases.
The percentage of new UL/IUL/VUL business ceded in 2019 and YTD 9/30/20 is shown in Figure 8. The percentages for VUL business are generally higher than those reported for UL and IUL business.
Figure 8
Percentage of New UL/IUL/VUL Business Ceded
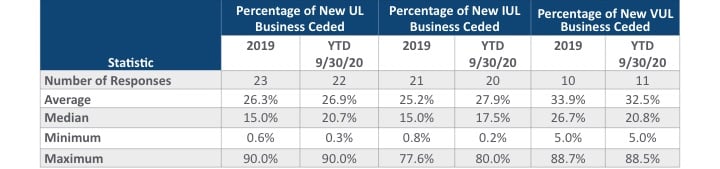
Abbreviations: IUL, indexed universal life; UL, universal life; VUL, variable universal life; YTD, year to date.
Investment strategy
The use of a new-money crediting strategy versus a portfolio strategy in pricing UL/IUL products was reported in the survey. Figure 9 shows the split between respondents assuming a new-money strategy and a portfolio strategy by UL/IUL product type.
Figure 9
UL/IUL New-Money vs. Portfolio Crediting Strategy
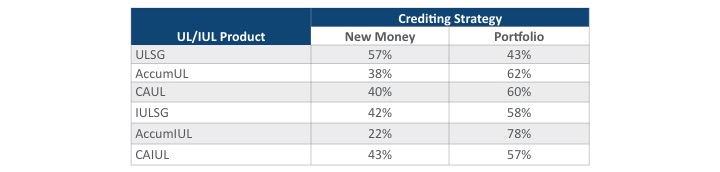
Abbreviations: AccumIUL, cash accumulation IUL; AccumUL, cash accumulation UL; CAIUL, current assumption IUL; CAUL; current assumption UL; IUL, indexed universal life; IULSG, indexed universal life with secondary guarantees; UL, universal life; ULSG, universal life with secondary guarantees; YTD, year to date.
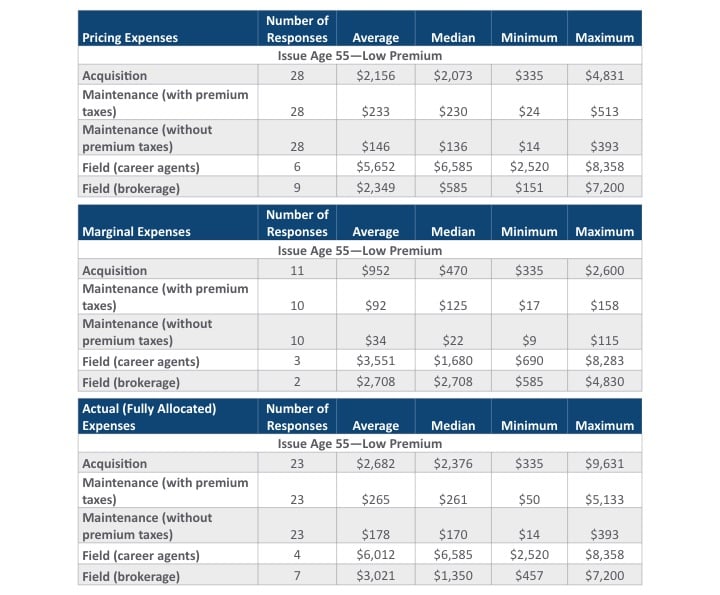
Expenses
Actual expense levels, marginal expenses, and those assumed in pricing UL/IUL/VUL products vary widely among survey participants. For comparison purposes, we converted acquisition, maintenance, and field expenses (separately for career agent and brokerage channels) to a dollar amount for a representative sample policy for each participant. (Commissions were not included.) The calculation was done for pricing, marginal, and actual (fully allocated) expenses. An average face amount of $500,000 issued at age 55, and premiums of $12 per $1,000 of face amount were assumed. The calculations were done including and excluding premium taxes. Other scenarios were included in the report (e.g., other premium amounts, issue age 35).
The tables in Figure 10 show statistics relative to dollars of pricing, marginal, and actual expenses for the representative sample policy for issue age 55 with a low premium, both including and excluding premium taxes. Note the number of responses received varies between the pricing, marginal, and actual expense categories.
Figure 10
Expenses for a Representative Sample Policy
IUL Illustrations
Actuarial Guideline 49-A (AG 49-A) applies to IUL illustrations on applicable policies sold on or after Dec. 14, 2020. This guideline was put in place in an attempt to again level the playing field when illustrating IUL products, by addressing issues caused by new IUL product designs that were not contemplated in AG 49 (e.g., multipliers, cap buy-ups, negative loan spreads). Changes in illustrated rates for IUL products under AG 49-A relative to AG 49 were reported by 17 of the 22 participants that write IUL business. The change in rates ranged from -120 bps to +32 bps, with a mean of -38 bps and a median of -23 bps.
Twenty-one participants replied to questions about the continuation of bonuses, multipliers, and cap buy-ups on IUL products under AG 49-A. As a result of AG 49-A, 19 participants believe that bonuses will continue to be offered on IUL products, and two participants believe they will not continue to be offered. Sixteen participants believe that multipliers will continue to be offered and five believe they will not. For cap buyups, 18 participants believe they will continue to be offered and three do not believe they will continue to be offered. Eight participants reported that they believe other index enhancement features will continue to be offered on IUL products under AG 49-A.
Conclusion
How has the COVID-19 pandemic and interest rate environment impacted the UL/IUL/VUL market? This survey includes the results of actions taken during a difficult and challenging first three quarters of 2020. The unique experiences of the recent past illustrate the importance of being on top of industry trends and reacting quickly to stay competitive in these markets.
A complimentary copy of the key discoveries of the June 2021 Universal Life, Indexed Universal Life, and Variable Universal Life Issues report may be found at
Statements of fact and opinions expressed herein are those of the individual authors and are not necessarily those of the Society of Actuaries, the editors, or the respective authors’ employers.
Susan J. Saip, FSA, MAAA, is a consulting actuary in the Chicago office of Milliman. She can be reached at sue.saip@milliman.com.