
Bias and Fairness in Modeling and Underwriting
By Benjamin Brew, Cole Frank, Amy Atkinson and Hareem Naveed
Actuary of the Future, October 2022

Probabilistic and statistical modeling have long been central to life insurers’ efforts to responsibly manage and accurately price risk. However, over the past two decades, technological advances have transformed these businesses’ use of data and algorithms. Machine learning, for example, is well suited for the risk assessment and classification tasks entailed by life insurance underwriting. Insurers have also started incorporating a wider range of data sources into the underwriting process, including but not limited to prescription histories, medical claims, electronic health records and credit-based mortality scores.[1] The use of new data sources and automated decisioning in life insurance has prompted concern about the fairness and transparency of these often high-impact decisions.
While proponents of the advancements argue that these new methods and data sources will expand insurability, regulators and policymakers are increasingly concerned with ensuring the fairness and transparency of these systems. Governing bodies in Europe have made a push to require certification for all AI models in use and reserve the right to decommission models that are deemed high risk.[1] The U.S. has not been as prescriptive about AI regulation as the EU, but in the last few years, regulators and lawmakers have begun to take note of the risks posed by algorithmic bias in the financial services industry. For example, the National Association of Insurance Commissioners (NAIC) released a draft outlining guiding principles for AI in 2020.[1] At the federal level there have been several recent attempts to regulate the use of automated decision systems by private companies, but most never make it out of committee.
Fortunately, researchers and data scientists in both industry and academia continue to make progress around fairness and transparency in machine learning. The bulk of this progress has been centered around (1) testing and defining both fairness and bias in an algorithmic context and (2) explainability and interpretability in machine learning models. The progress in both the regulatory and research contexts provide benefits to the consumer which in the insurance context is ultimately the policyholder.
Bias and Fairness
It is difficult to pin down one definition of “bias” and “fairness” in the algorithmic context. In academic literature there are dozens of different, and in many cases incompatible, descriptions and definitions.[2]
The US legal perspective centers around the doctrines of disparate treatment and disparate impact. The former, codified in employment law and credit provision, is the idea that certain protected attributes should have no bearing on an outcome.[3]The latter states that regardless of intent, any practice that results in disproportionately adverse outcomes for some protected groups is discriminatory.[4] A data scientist might account for the doctrine of disparate treatment by excluding variables from the model that are related to protected groups. Disparate impact, on the other hand, might entail testing the model output for bias—for example, ensuring the model flags the same proportion of individuals from each group (demographic parity). There are shortcomings to both approaches: Other variables will generally proxy for excluded ones and limiting your model to perfect demographic parity could lower the overall accuracy.
A more nuanced approach to algorithmic fairness focuses on equalizing the model’s error rates across protected groups. Hardt et al. [2016] propose two versions of this approach: (1) equalized odds, which entails equalizing both true and false positive rates across the protected attribute values, and (2) the less restrictive equalized opportunity, which entails equalizing either true positive rates or false positive rates (but not both) across protected attribute values. The intuition for this definition of algorithmic fairness is that model performance should not differ by group. A model satisfies equalized opportunity only if a member of some group is equally likely to be falselyflagged as a member of some other protected group (or falsely unflagged). For example, in a classification model that detects fraud, men would have the same probability of a false positive (or false negative) as women.
There are several common error-related fairness metrics, and the choice of which to prioritize depends on the purpose and context of the model. Saleiro et al. [2019] introduce a “fairness tree” to help determine which error-related fairness metric to focus on in a given context.
Chart 1
A Fairness Model
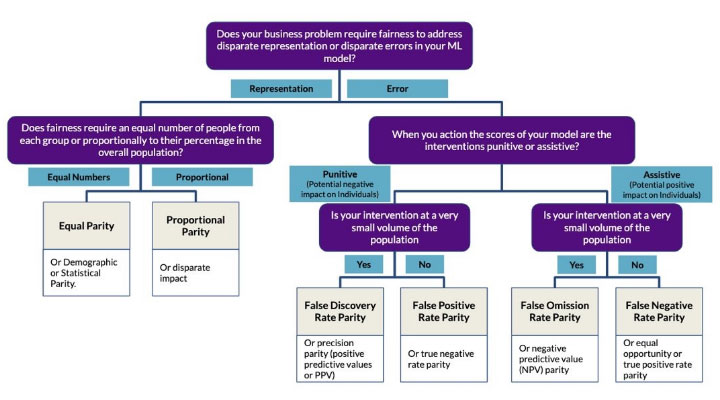
Chart 1 is adapted from Saleiro et al. (2019). (1811.05577.pdf (arxiv.org))
Explainability and Interpretability
In many applications, the complexity of a model closely tracks the accuracy. Some of the recent breakthroughs in artificial intelligence (i.e., GPT-3, protein folding) have come from complex neural networks that are difficult to interpret. Although the application of such models in life insurance risk assessment is limited, consumer interests have strengthened the call for more transparency across all industries. Machine learning model transparency is usually achieved by the use of one of two methods: (1) a directly interpretable machine learning architecture (“glass box models”) or (2) some additional methodology or model to derive a post-hoc explanation of the model’s decisions (“black box explanation”).
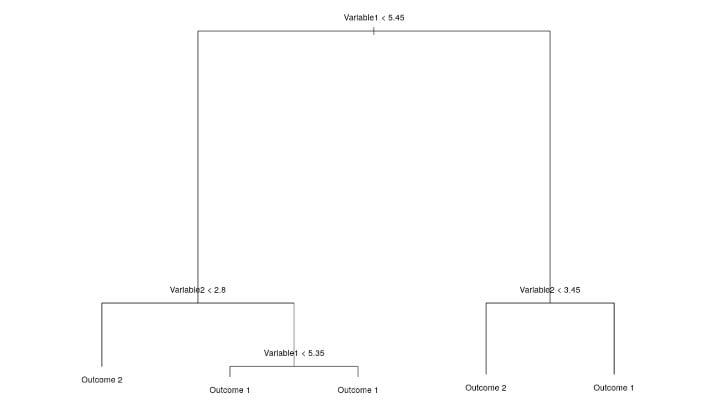
Glass box models, though generally less complex, can still offer high accuracy with the benefit of straightforward interpretation. In a decision tree, for example, any individual prediction can be understood by retracing the path of that observation from the root node (top of the tree) to the terminal node, or bottom of the tree (Figure 1). Generalized linear models are also considered “glass box”—the weight associated with each feature (predictor) can be directly interpretable, or in the case of the logistic regression, transformed into odds ratios
Figure 1
Retracing Path of Observation
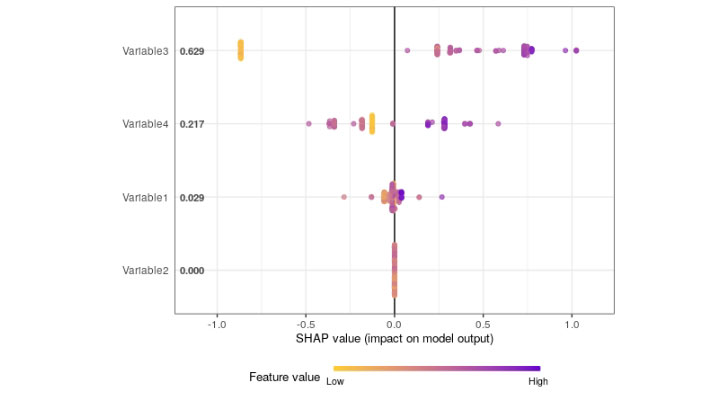
More complex models don’t have the convenience of built-in interpretation. However, in recent years we’ve seen valuable progress in post-hoc explanatory methods. Lundberg and Lee [2017] [5] introduced a unified approach to interpreting the predictions of any model. Shapley additive explanations (SHAP) leverages coalitional game theory to measure the contribution of each feature (or variable) to the prediction (Figure 2). These contributions (SHAP values) can be averaged and visualized to rank the importance of each feature in the model. LIME, or local interpretable model agnostic explanations, is another open-source method for interpreting black box models. This method essentially tests the model by feeding it slightly altered versions of the original data and evaluating how the predictions change. Both methods seek to explain which inputs to the model are contributing to the observed outcomes.
Figure 2
Example of Use of Shapley Additive Explanations
A Case Study in Mitigating Bias
Misrepresentation models are typically used in an accelerated underwriting (AUW) context to triage applicants. Studies show that applicants in an AUW program are most likely to misrepresent their BMI and smoker status in order to get a more favorable rate class. These models can identify individuals based on application answers or third-party data, likely to misrepresent critical information about themselves. Flagged applicants are then referred to full underwriting to verify their self-disclosed data. Based on the thin pricing margins for AUW programs, even a 10 to 20 percent precision rate for a misrepresentation model can lead to significant mortality cost savings.
In a hypothetical AUW program we might observe that of the applicants flagged for potential misrepresentation, 60 percent are women and 40 percent are men. However, disparate outcomes between groups does not necessarily imply that the model is introducing additional bias into the AUW program, even if gender is used as a predictor. Instead, we should explore how the model misclassifies individuals across groups—particularly the false positive rate (FPR). If for example, the FPR for females is 27 percent, but only 8 percent for males, the model would be biased (0.27/0.08 = 3.25; female FPR is 3.25 times the male FPR). This type of bias analysis is called “false positive rate parity” and is one of many error-based strategies used to evaluate bias.
After identifying and measuring bias in the model output, the next step would be to update or retrain the model, using different inputs, weights, or thresholds. However, bias mitigation steps tend to overlap with general best-practices for model building: Thoughtfully selecting features that are relevant to the task at hand, ensuring the dataset is representative of the population as a whole and of protected groups, checking for any potential data labelling and measurement issues.
Conclusion
As the field of machine learning evolves, so must the strategies for mitigating bias and improving transparency. This is especially true in life insurance, where models play a vital role in risk assessment and decisioning. Our industry has a unique opportunity to not only implement, but also develop tools and strategies to ensure machine learning is used in a transparent and equitable way. Ultimately this will lead to a more efficient and fair underwriting process.
Statements of fact and opinions expressed herein are those of the individual authors and are not necessarily those of the Society of Actuaries, the newsletter editors, or the respective authors’ employers.
Ben Brew is a senior data scientist in Integrated Analytics with Munich Re, Canada Life. He can be contacted at bbrew@munichre.ca.
Cole Frank is a graduate student at the University of Chicago. He can be contacted at cvf@uchicago.edu.
Amy Atkinson is Deputy General Counsel and Chief Compliance Officer at Munich Re Life US. She can be contacted at aatkinson@munichre.com.
Hareem Naveed is a data scientist and Assistant Vice President of Integrated Analytics with Munich Re Life US. She can be contacted at hanaveed@munichre.com.