
Managing Investment Risks in Contractual Designs
By Runhuan Feng and Longhao Jin
Expanding Horizons, November 2021

Life and annuity markets around the world have seen increasingly complex investment-combined products, including universal life, fixed indexed annuities, variable annuities with a wide variety of guaranteed benefits and indexed variable annuities. Insurance companies are facing unprecedented exposure to financial risks in addition to traditional mortality and longevity risks. The risk assessment and modeling for such complex designs by conventional methods often focus heavily on their market competitiveness and profitability. However, there seems to be a lack of quantifiable and systematic approaches to assess investment risks associated with investment-combined products. The objective of the proposed work is to develop a framework for quantifying and analyzing various forms of contractual designs and to showcase different techniques to assess the trade-off between competitive contractual designs and their practical implications regarding the difficulty of risk management.
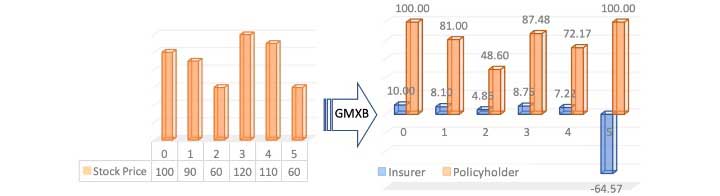
As a general principle, we think of a contractual design as a mapping from the dynamics of the underlying risk(s) to an insurer’s financial obligations. Suppose an investor has $100 to invest either directly in a stock or in a variable annuity contract linked to the same stock.
The left panel of Figure 1 shows the evolution of stock prices over a period of five years. If left unprotected, the investor is fully exposed to equity risk, and the investment varies exactly by the same amount as stock price. The variable annuity (VA) contract offers a guaranteed minimum maturity benefit, which guarantees a minimum balance of $100 after five years. The cash flow is now split between the policyholder and the insurer, who underwrites the variable annuity contract. The right panel of Figure 1 shows the new set of cash flows between the policyholder and the insurer. In compensation for the guaranteed benefit, the policyholder pays 10 percent of the account values on an annual basis to the insurer. From the figures, we know that even though the investor’s investment still varies in proportion to the stock price, the investor receives a boost to that investment due to a benefit payment from the guaranteed minimum maturity benefit (GMMB) at maturity. Therefore, the equity risk is partially transferred from the policyholder to the insurer, who receives annual fee incomes and carries the financial obligation to absorb some of the policyholder’s loss.
Figure 1
A Mapping from the Dynamics of Equity Risk to an Investment Guarantee
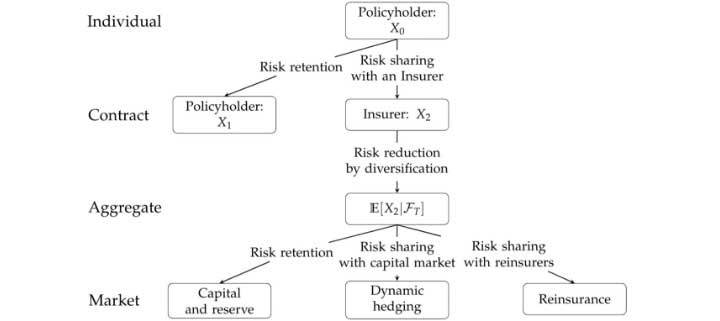
In general, there are four well-known risk management techniques: risk avoidance, risk reduction, risk sharing and risk retention. The last three are often combined in various ways in contractual designs. Adding to the complexity is the interplay of various types of risks such as equity risk, inflation risk and mortality risk. Figure 2 shows how risks are transferred among various stakeholders including policyholders, insurers, reinsurers and capital market. This quantitative framework was developed in Feng’s introduction to computational risk management.[1] Policyholders are most concerned about the risk transfer from policyholder to an insurer in the first step, since it quantifies how much risk is reduced when they purchase a product. The insurers pay more attention to the second and third steps, as they show the insurer’s capacity of coping with risks ceded by the policyholder. In the figure, X0 and X1 represent the policyholder’s financial position from purchasing the product without and with the guarantee, respectively, and X2 represents the insurer’s financial position from selling the product with the guarantee. The conditional expectation E[X2│FT ] gives the insurer’s financial position when the mortality risk is absorbed.
Figure 2
Effect of Risk Transfer at the Contract Level
Three common types of guarantees in the market are guaranteed minimum maturity benefit, guaranteed minimum death benefit (GMDB) and guaranteed minimum withdrawal benefit (GMWB). We show the risk transfer at the contract level as well as the risk reduction at the aggregate level with numerical illustrations and consider two different types of risks, namely equity risk and mortality risk.
The Effect of Risk Transfer at the Contract Level
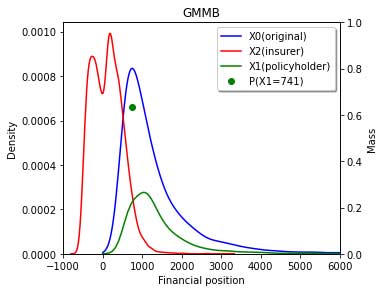
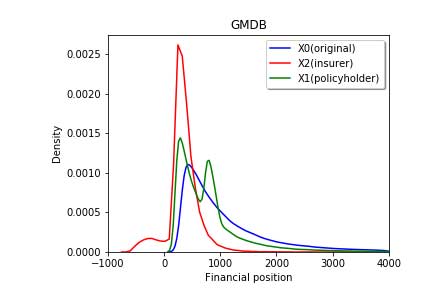
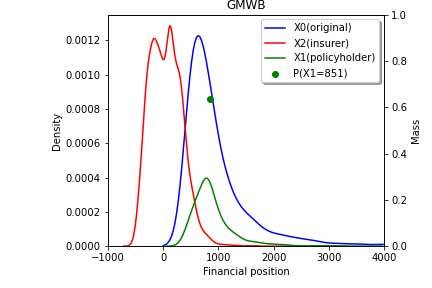
Figures 3a, 3b and 3c show the risk-sharing effect of the GMMB, GMDM and GMWB products. The red line shows the probability density function of the insurer’s financial position, and there are two peaks in three figures. In Figures 3a and 3b, the peak on the right shows the most likely range of fee incomes contributed by policyholders who survive to maturity. In Figure 3c, the peak on the right represents a balance in the policyholder’s account at maturity. The peak on the left in each figure indicates the most likely range of the insurer’s net loss due to benefit payments. It is clear from the figures that the insurer carries most of the downside risk as its probability density function centers around near zero levels. The blue and green lines represent the investor’s risk profile before and after purchasing the product. The probability mass of the green line shows the guaranteed amount of benefit paid to the policyholder. For GMMB and GMDB products, it is the guaranteed benefit payment if the policyholder survives to maturity and the investment account performs badly. Similarly, it is the guaranteed amount of full withdrawal paid to the policyholder for a GMWB product. We know from all three figures that the policyholder gives up some portion of upside gain in exchange for protection from the insurer for the downside loss.
Figure 3
Effect of Risk Transfer at the Contract Level
a. GMMB
b. GMDB
c. GMWB
Risk Reduction at Aggregate Level
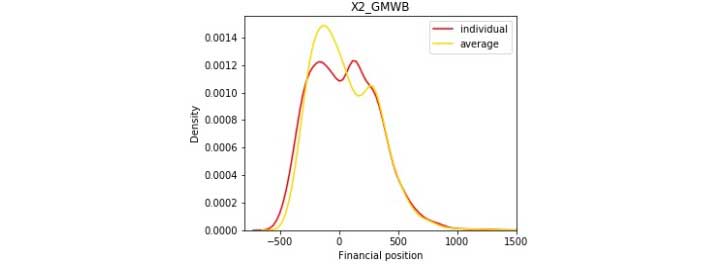
Figures 4a, 4b and 4c show the risk reduction effect at the aggregate level, where we assume there is a sufficiently large number of policyholders so that the law of large numbers applies, and the mortality risk is completely diversified. In contrast to the yellow line, which is the individual liability at the contract level with undiversified mortality risk and equity risk, the red line represents the insurer’s average liability at the aggregate level with diversified mortality risk and undiversified equity risk. Due to the fact that extreme scenarios are more likely to happen with the interaction of mortality and equity risk, the yellow line is more concentrated than the red line.
Figure 4
Risk Reduction at the Aggregate Level
a. GMMB
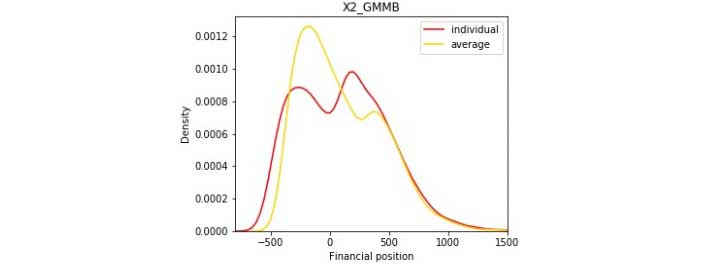
b. GMDB
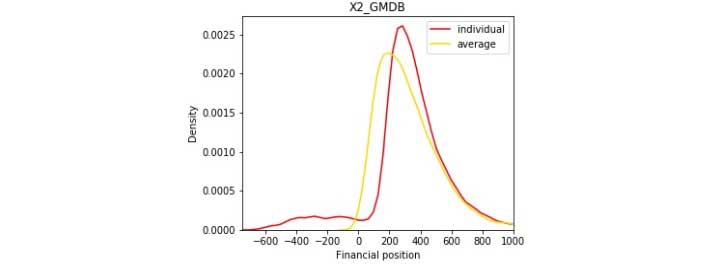
c. GMWB
In summary, all three different guarantees offer protection on the downside loss, but the policyholder gives up some portion of the upside gains. Moreover, after the diversification effect on the mortality risk, the risk is reduced in the guaranteed annuities. To have a broader view of the contractual design, we compare three guaranteed annuities in Table 1, from which we make the following observations.
Table 1
Confidence Intervals for Policyholder’s and Insurer’s Financial Position
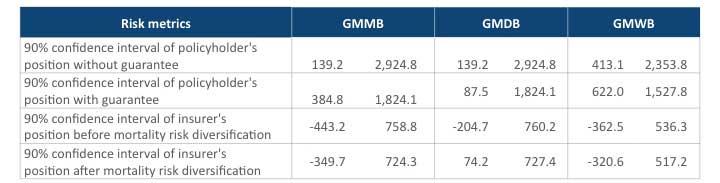
First, we know from the first row that the GMWB has the narrowest interval of the three, which means it provides a safer financial position to the policyholder without any guarantees. It is consistent with the product feature of the policyholder withdrawing a certain amount of money from the account so the policyholder’s asset is less exposed to equity risk. Second, the policyholder’s financial position without guarantee is identical for GMMB and GMDB. However, when we consider the case where the policyholder purchases the guaranteed annuity product, the situation is different. The lower boundary of the confidence interval for the policyholder’s position with the GMMB is higher than that with the GMDB. This is because the policyholder is likely to survive the contract period and is hence exposed to the equity risk after the GMDB expires, whereas the policyholder’s account is floored by the GMMB after the period. Since the chance of the policyholder dying within the contract period is rather low, the policyholder is most likely to end up with account value without any guaranteed payment when the GMDB expires. The right tail captures favorable scenarios in which the account values outperform the guaranteed base under the GMMB. Hence, the GMMB and the GMDB have the same right tail. The GMDB rider leads to the narrowest confidence interval of the insurer’s profit. If confidence intervals before and after risk pooling are compared, the improvement is the smallest with the GMWB due to most individuals surviving before the rider expires, and the impact of mortality risk being rather small. The fact that the GMDB rider appears to be more profitable than the other two and the GMWB is the least profitable is attributed to the policyholder having a relatively high probability (0.82) of surviving to maturity, so the GMDB payments are not always needed.
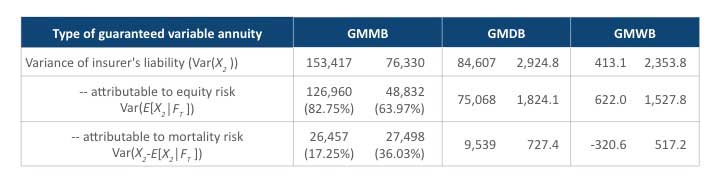
Table 2 offers a breakdown of the variance of the insurer’s liability for each product type. As explained earlier, the insurer’s liability after the pooling of mortality risk, E[X2│FT ], is less than or equal to that prior to the pooling, X2, and hence the variance of the former is clearly smaller than the variance of the latter. It is also well known that E[X2│FT ] is uncorrelated with X2 - E[X2│FT ]. The mortality risk is completely diversified in E[X2│FT ]. Therefore, it is natural to separate the variances, which are attributable to different sources. It is clear from Table 2 that mortality risk contributes the most to the variability of the GMDB liability and the least to that of the GMWB liability.
Table 2
Risk Analysis for Different Guaranteed Benefit
While the preceding discussion concentrates on the interplay between mortality risk and equity risk, we now consider another type of risk: inflation risk. Many insurance products offer inflation protection features, under which benefit payoffs increase periodically to keep up with inflation. Inflation protection features are common for products that offer benefits in the form of annuities, such as a cost-of-living adjustment on life annuity and disability insurance. Because these products are typically bought many years before the first annuity payment is drawn, the cost of living or care may have far exceeded its original estimate. Therefore, inflation protection is critical for policyholders to retain the real value of its insurance protection. While these features are considered desirable for policyholders, they can be difficult for insurers to manage. Detailed discussions of these features can be found in other studies.[2]
The purpose of this work has been to develop a quantitative framework in which we can quantify and assess the connection between various contractual designs and associated risks. We have analyzed the interplay between the mortality risk and the equity risk in the common guaranteed annuity products and displayed the comparisons between them. We have also provided a way of managing the inflation risk for the insurers in the annuity market.
Runhuan Feng, FSA, CERA, PhD, is a professor of mathematics, statistics, industrial systems and enterprise engineering; director of actuarial science; director of predictive analytics and risk management; and the State Farm Companies Foundation Professional Scholar at the University of Illinois at Urbana-Champaign. He can be reached at rfeng@illinois.edu.
Longhao Jin is a PhD student in the mathematics department at the University of Illinois, Urbana-Champaign. He can be reached at jinlonghao93@gmail.com.