
Building a Narrative Around LDTI Discount Rate Updates
By Scot Glasford
The Financial Reporter, April 2021

The introduction of GAAP long-duration targeted improvements (LDTI) will create more volatility in financial results, as updates to assumptions and data used to calculate financials are required at least annually. Additional scrutiny from internal and external stakeholders demanding increased transparency and explanations will meet this increase in reporting volatility. Actuaries will be required to help their accounting and finance colleagues develop a narrative for the financial results. In short, LDTI has added storytelling to the actuarial job description.
The first test for actuaries will be to explain the opening LDTI balance sheet. In particular, explaining the impact on reserves due to shifting to current prevailing discount rates from original discount rates is necessary. Under LDTI, reserve balances accrue interest at the original discount rate for ordinary income, and other comprehensive income (OCI) captures the impact of changes to the prevailing discount rate in the period. Accumulated other comprehensive income (AOCI) captures reserve balance impacts from using the original discount rate versus the current discount rate on the balance sheet.
Given the historically low interest rate environment, moving from the original discount rate to the current prevailing discount rate may impact many insurers. Reported AOCI will capture this dynamic, and impacts to surplus will be felt.
This article will discuss the potential impact that the discount rate update will have on the opening balance sheet by modeling LDTI reserves using historical yield curves. Ultimately, using illustrations of historical yield curves that highlight their shape, level, and how they relate to one another can explain LDTI's discounting conventions and potential impacts on surplus.
Creating a Narrative Around Impacts fFom Opening AOCI
To explain the impact on reserves (and equity) from transitioning to LDTI, companies will need to explain how interest rates have evolved since they first sold the book of business. To tell a complete story, the actuary should answer the question: "What did rates look like when we wrote our business?"
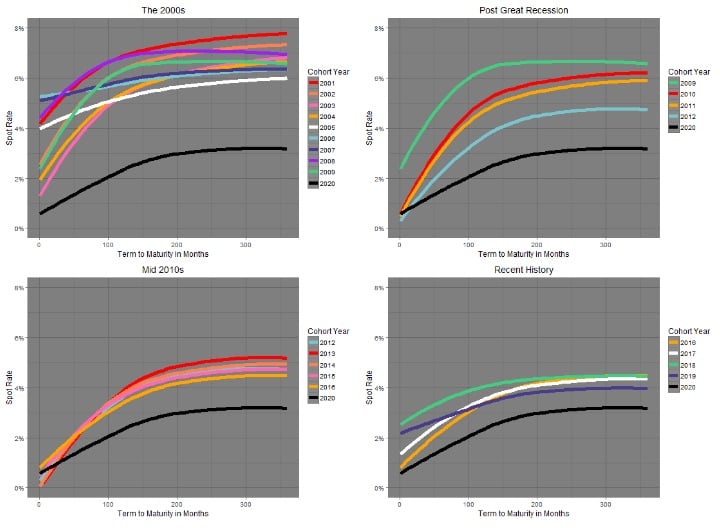
Illustrations help visualize rates and conceptualize the history of interest rates. The graphs below show corporate yield curves for each year dating back to 2001. The data used to produce the corporate yield curves is from the high-quality market (HQM) data set provided by the US Treasury Department. The HQM curve represents the yield of available high-quality corporate bonds, rated A through AAA. Note that the credit quality of HQM data is of higher quality than what will be used under LDTI (single-A rated).
The graphs show averages of monthly HQM data by calendar year. These calendar year averages of monthly HQM data represent original discount curves for an annual cohort, and these curves span the past 20 calendar years.
Rolling Up The Curve
Before reviewing historical data, it is essential to understand the nuance of LDTI discounting under original discount rates. When calculating reserves using original discount rates, discount rates "roll up the yield curve" as time moves forward. This concept may not be intuitive, and it is worth reviewing a simple example.
The following example demonstrates the discounting of liability cash flows using the original yield curve and spot rates.
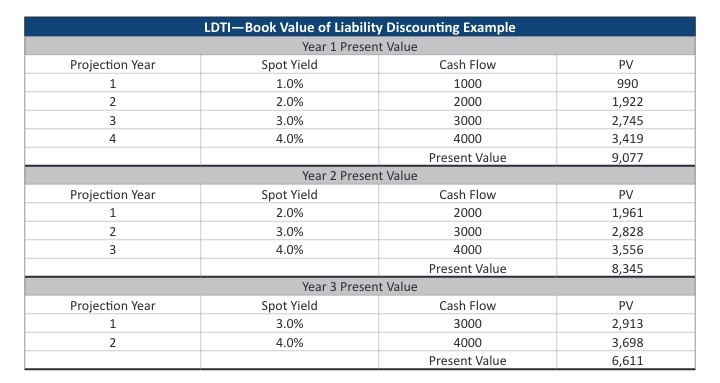
As the example demonstrates, as time marches on and the valuation date moves from year one to year three, the discount rates increase. The increase results from using an upward sloping yield curve and discarding the prior year's initial discount rate. When doing the valuation in year one, the first year of projected cashflows has a 1 percent discount rate. When doing the valuation in year two, the first year of projected cashflows has a 2 percent discount rate and discards the yield curve's first-year yield. The 2 percent discount rate matches the second year from the original yield curve. The process continues in year three as discarding the second-year yield is required when doing the year three valuation. Dropping the original curve rates as time moves forward is referred to as the "lopping off" method or "rolling up the curve."
Cohort Discount Curves
For purposes of analysis, we grouped the 2001 to 2020 period into four eras:
- The 2000s: (2001–2009)
- Post-Great Recession (2009–2012)
- The Mid-2010s (2012–2016)
- Recent History (2017–2020)
We present the graphs from each of these periods below. The 2020 yield curve is used in each graph to contrast with historical rates.
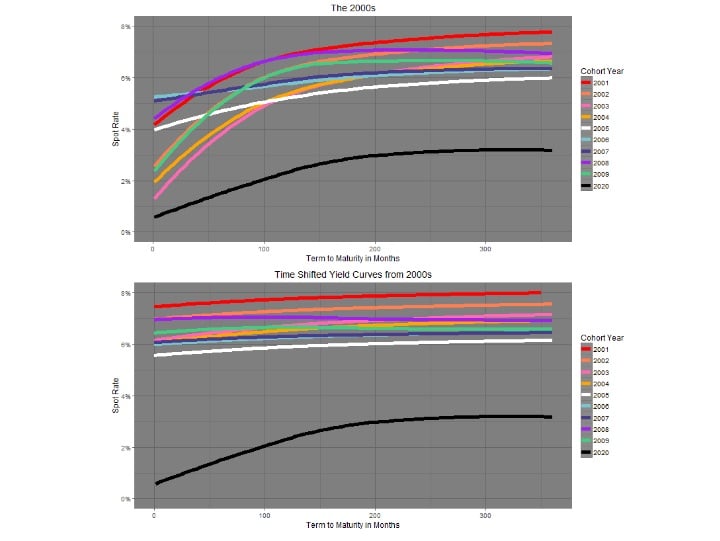
Also increasing the impact of the current interest rate environment is the rolling up the curve dynamic discussed earlier. Even though the yield curve is "locked-in," as the valuation date moves forward in time, so does the yield curve. To illustrate the effect of this, we re-illustrated the yield curves from the 2000s to align with a 2020 valuation date. The contrast between the curves illustrates the dynamic of lopping off short rates by contrasting the original yield curve's shape to that of modeled original yields as of the valuation date.
 Impact on AOCI From Falling Rates
As shown by the previous graphics, the 2020 bond market hit historic lows for bond yields. As insurers begin to analyze the potential impact of LDTI, the impact of updating the discount rate to reflect today's interest rate environment might have a very significant impact on reserves, especially if yields stay at 2020 levels.
To demonstrate this point, we built a Prophet model with 20 different annual cohorts, representing each of the past 20 years, and produced LDTI financial statements, including the opening balance sheet and the AOCI impact due to the change in discount rates.
The model we used had the following characteristics:
- The product is a generic whole life contract.
- Each cohort had identical demographics.
- Each cohort followed the modified retrospective method for LDTI transition.
- Each cohort has a 60 percent net premium ratio, and transition reserves varied to calibrate net premium ratios.
- Transition reserves for older cohorts were higher than that of younger cohorts.
- The duration of liability cashflows is between 13 and 15.
- The modeled business is assumed not to have gone through loss recognition.
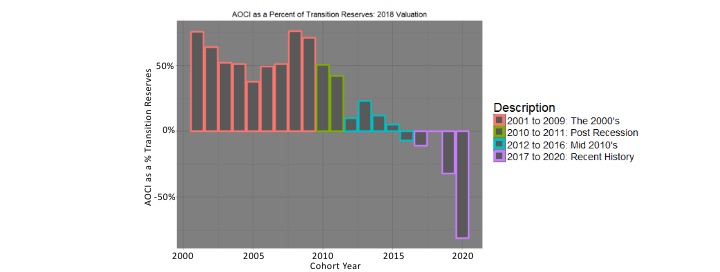
The below graph depicts the impact of the change in the discount rate (represented by AOCI amount) as a percentage of the reserve at transition. For instance, the model results show that for the 2009 cohort, a FAS 60 reserve of $1 million would turn into a $2 million reserve under LDTI, with the additional $1 million allocated to AOCI.
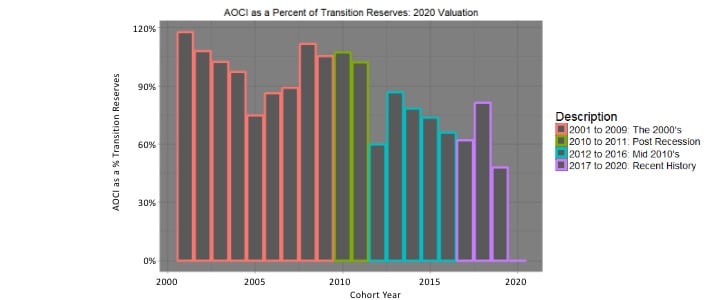
Interesting points to note about the 2020 results:
- Impacts for business written in 2011 and prior is substantially different from business written after 2011.
- 2001 has the highest impact due to the updated discount rate.
- The impact became more muted in recent years, as interest rates have fallen. 2018 is the exception to this rule, consistent with comparatively higher rates in that year.
Moving Forward
There has been some talk recently about the prospects of inflation returning to the United States. Rates may be increasing in the coming months, and the historic lows, represented by the 2020 yield curve, may not reflect the prevailing rates when LDTI comes into effect.
To demonstrate the impact of a rising interest rate environment, we looked at results assuming that the 2018 curve was the prevailing yield curve. The results are below.
Interesting points to note about the 2018 results:
- The impact for business written in 2011 and prior is approximately half the estimated impact of using the 2020 curve for current reserve calculations.
- Use of the 2018 yield curve shows that written business between 2012 and 2017 would have minimal AOCI impact.
As demonstrated, the prevailing interest rate environment at the time of transition will loom large for how impactful LDTI is on the opening balance sheet and GAAP equity. LDTI results using 2020 yields could be shocking. If rates begin to rise and return to 2018 levels, more minor GAAP equity impacts should follow. In either case, interest rates and their immediate impacts on earnings and surplus will be a much more significant part of the story under LDTI than it is under current GAAP.
Statements of fact and opinions expressed herein are those of the individual authors and are not necessarily those of the Society of Actuaries, the editors, or the respective authors’ employers.
Scot Glasford, FSA, MAAA, is a senior actuarial product manager at FIS Global. He can be reached at Scot.Glasford@fisglobal.com.