
S&P Global’s Proposed Capital Model Changes and its Implication to U.S. Life Insurance Companies
By Yiru (Eve) Sun, John Choi, and Seong-Weon Park
The Financial Reporter, September 2022

S&P Global released its initial version of proposed changes regarding its Insurer Risk-Based Capital Adequacy methodology and assumptions on Dec. 6, 2021. Unlike prior guidance notes or criteria releases, the proposed changes comprehensively updated the current S&P rating criteria released in 2010. These updates will directly impact many insurers. S&P Global anticipates that 10 percent of existing ratings in the insurance sector will be impacted and the change will lead to more positive rating implications than negative impact. This article focuses on the proposed changes on the S&P risk-based capital (RBC) versus the S&P's current GAAP capital model[1], then simulates impacts to a representative U.S. life insurer through an illustrative case study.
Risk-Based Capital
Conceptually, the risk-based capital model is an assessment of the capital that a company should hold to sufficiently cover its liabilities in the event of an adverse scenario. The more severe the adverse scenario the company can withstand, the better the rating that will be granted. As the requirements for determining the risk-based capital adequacy are stated by S&P Global, it is possible to dissect how specific changes may impact the final RBC amount required for a desired S&P Global rating.
It is important to understand RBC changes not only at the individual risk component, where the dominating impact from changes will rest on the granularity and level of capital charges, but also the overall diversification impact, which strongly influences final capital requirement. Although generalities are best avoided, overall, the proposed capital charges on most risks have increased, mostly because the confidence levels that S&P Global uses to calibrate risk charges are increased to 99.5 percent (moderate stress), 99.8 percent (substantial stress), 99.95 percent (severe stress), and 99.99 percent (extreme stress) from 97.2 percent, 99.4 percent, 99.7 percent, and 99.9 percent, respectively. However, greater diversification allowances under the new model have been provided that in many cases will allow companies to hold lower capital levels, in aggregate.
Life Technical Risks
Life technical risks measure the possible losses from deviations from the best estimate assumptions relating to life expectancy, policyholder behavior, and expenses. The life technical risks are captured through mortality, longevity, morbidity, and other risks. The methodology for calculating the capital adequacy for these four risk categories remains unchanged under the proposed method, apart from the recalibration of capital charges or the consolidation of defining categories within each risk. Comparing to the current GAAP based model, charges have materially increased across all categories partly due to higher confidence intervals, with notable exceptions of longevity risk, with reduced charges across all stress levels (changes applicable to U.S. life insurers are illustrated in Tables A2 to A5 in the Appendix linked at the end of this article). Please note that S&P’s current capital model under U.S. statutory basis does not have an explicit longevity risk charge. However, this article focuses on comparison to current GAAP capital model[1] that is closer to the new capital methodology framework.
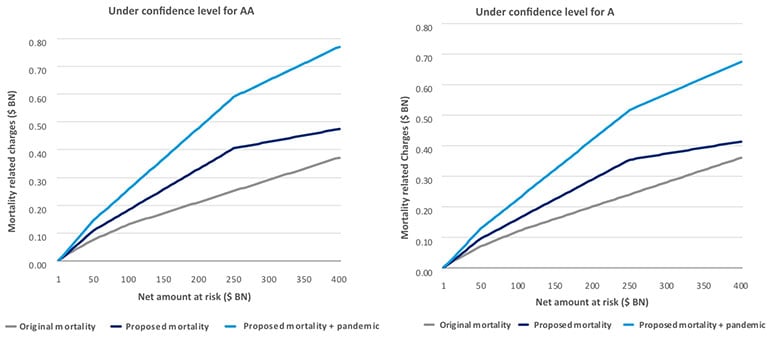
For mortality risk, lower rates are charged for smaller exposures (net amount at risk (NAR) $5 billion or less) with the consolidation of size categories, but higher rates are charged for NAR between $5 billion and $250 billion, with an average increase of 49 percent for businesses under $400 billion NAR. A new pandemic risk charge (Table A3 in the Appendix linked at the end of this article) will further increase mortality related risk charges to be 109 percent higher than original mortality charges under confidence level for company rating of AA, and 93 percent higher for confidence level for company rating of A, respectively, on average (Figure 1). The disability risk charge rates increased moderately for most products, across all eight product types such that the increase of disability premium risk charges is 6 percent under confidence level for AA, and 2 percent for A, respectively. In addition, the proposed model introduced a new charge on disability claims reserve, ranging from 13.7 percent of total disability claims reserves for AAA, to 9.6 percent for BBB. However, the proposed model provides lower capital charge rates in longevity risk and lapse risk.
Figure 1
Proposed Versus Original Mortality Risk Capital Charges for Highly Developed Life Markets
Market Risks
Market risks measure the possible losses from adverse movements in the market environment, gauged through the sub-categories equity, real estate, and interest rate risks. Equity and real estate risks follow a similar methodology where exposure to each risk is gauged by the application of prescribed capital charges, and, overall, these two risks have not seen a change to this basic methodology. Updated charges, though, do tend to fall heavier for equity risks, likely driven by the more stringent confidence intervals, whereas real estate charges have seen a minimal impact in comparison.
Interest rate risk, although differently measured from equity and real estate risks, continues to be measured by the product of an interest rate stress assumption and duration mismatch assumption. Like that of equity risks, the interest rate risk assumption has been recalibrated upward, driven by more stringent confidence intervals. Under the new proposal, added emphasis is placed on the insurer-specific modified asset and liability duration mismatch, which can increase capital charges if a company’s ALM mismatch differs from the current assumed one-year duration mismatch for all US Life insurers. Insurers with tighter ALM duration mismatches may see lower ALM risk charge, subject to a floor of 0.5 years. A more detailed interest rate shock is shown in Table A6 in the Appendix linked at the end of this article.
Credit Risks
Credit risks measure the possible default losses within a company’s asset portfolio. The current capital model provides an assignment of capital charges based on differing asset classes, but as most of U.S. life insurers will have an asset portfolio comprised mainly of long-term corporate bonds and commercial mortgage loans, the focus will be upon the relative impacts seen for these two specific asset classes. The current framework provides capital charges for these two splits with bonds being further categorized dependent on tenor and instrument rating. But the proposed methodology adds an additional level of granularity where bonds will have further categorization into four asset classes from the riskiest asset types of structure assets to the least risky of government and secured bonds. Overall commercial mortgage loans see an elevated capital charge level specifically where there is a low loan-to-value ratio. For bonds, specifically for the proposed category 2 assets for long duration assets over 20+ years, there is a flattening of capital charges across all rated instruments that should bring a reduction in capital levels for long-term investments. (Table A7 in the Appendix linked at the end of this article).
The proposed changes included a new five-step assessment tree to determine the rating input of bonds and loans. Unless a security has a rating issued by S&P Global, a downward adjustment applies on securities ratings even where a credit rating agency mapping exists. For example, corporate ratings issued by Moody’s and Fitch would have been lowered by one notch for investment-grade ratings. The most severe case was where a rating input or mapping could not be determined. For example, a security with no ratings from major rating agencies might be mapped to “CCC” rating status, which, along with unrated securities, would have had capital charge levels that are multiple tens of factors larger than “BB” or higher rated securities. As this original provision was under heavy scrutiny by the public, it has been withdrawn for further consideration by S&P Global.[2] As of the writing of this article this provision continues to be under consideration by S&P Global for an alternative replacement provision to be issued sometime in the future.
Diversification
Diversification benefits are generally from the risk aggregation methods for different types of risks. Overall, the proposed model provides a more sophisticated diversification framework. Within both life technical risks and market risks, the updated correlation factors provide greater rewards for diversification, allowing insurers to reap back some of the impacts seen from increased individual capital charges where relevant. Additionally, there is a new layer of diversification between the major individual risk categories that will provide even larger benefits for insurers with a more diversified portfolio (Table A8 in the Appendix linked at the end of this article).
Case Study: Sample Business Capital Charge Comparison
To assess the impact of the proposed changes, we have applied the S&P original GAAP capital model[1] and proposed capital charges on a sample business for comparison (Table 1). The illustrative business profile created for this analysis simulates a U.S. life insurer with both life insurance and annuity products with an asset portfolio heavily invested in long-term corporate bonds and commercial mortgage loans. From the resulting case study, the impact from the proposed changes leads to an overall reduction in the total RBC capital requirement. Strong contributors are the flattening capital charges for category 2 bonds (42 percent decrease in individual capital requirement) and the reduction in longevity risk charges (73 percent decrease in individual capital requirement), which strongly offset the impacts seen from the higher capital charges that have been introduced across all other types of risks. Additional benefits can be seen from the enhanced diversification correlations within individual risk categories (129 percent additional benefit for market risks and 111 percent on insurance risks) and the additional layer of diversification granted between the risk categories (12 percent additional benefit). Overall, these changes result in a decrease of 20 percent to the risk-based capital amount.
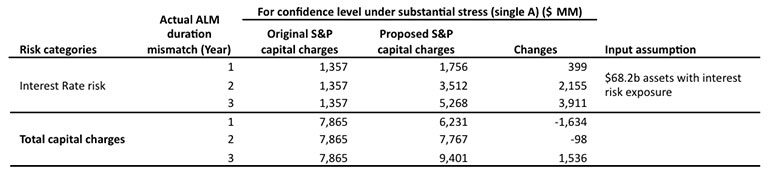
The case study in Table 1 assumes that the company specific ALM duration mismatch is one year, same as the default assumption in the original S&P model. In the S&P proposed model, when the ALM duration mismatch increases, this would significantly increase the interest rate risk and total capital charges in proportion to such a deviation as the duration mismatch impacts the overall interest rate risk as a multiplicative factor. For illustration, Table 2 shows that for a company with a one-year duration mismatch, the proposed S&P model will reduce the total capital charges in aggregate. However, for a company with a two-year duration mismatch, the aggregate impact is neutral due to (a) lowered capital charges for other components, but (b) increased ALM risk charge. For a company with ALM duration mismatch of three years or higher, it is likely that the company needs to increase capital charges or take actions to reduce the duration gap. So special care must be taken for lines of business with larger asset-liability duration mismatches, for example, whole life, universal life, structured settlements, and long-term care, where duration mismatches of upwards of five years are not unusual. The severity of the impact from this deviation will be dependent on the insurer’s effectiveness of its ALM strategies, including hedging strategies.
Table 1
Proposed Versus Original Risk Capital Charges for Sample Business

*Assuming Sample Business’ ALM duration mismatch is one year.
**Original charges here were calculated using the GAAP model.
Table 2
Impact of ALM Duration Mismatch on Interest Rate Risk and Total Capital Charges
As shown in the sample case study, most categories’ risk charge rates increased, with some exceptions like longevity risk and credit risk for category 2 assets, in the S&P Global proposed model. With diversification benefits being considerably enhanced, insurers that write more diversified product lines may enjoy a lower overall capital adequacy requirement. It may also be prudent to take note of the specific increases in capital charges seen on individual lines, with particular emphasis on affected life insurance products with high exposures to mortality and pandemic risk. Insurers should also continue to maintain focus on their asset portfolio’s risk-adjusted return so that they can enjoy benefits from the flattening capital charges on long-term duration corporate bonds. Insurers should also have added awareness on the effectiveness of their ALM risk profile as poor mismatches have a high potential to significantly increase the required capital charges compared to the current model.
Total Adjusted Capital
One aspect of the S&P Global capital framework that is outside the scope of this article, but warrants some commentary includes changes stemming from the total adjusted capital (TAC) framework under the proposed model. It should be noted that this portion of the S&P rating framework was not covered in the sample case study. However, in brief, the total adjusted capital framework remains similar to the original model. Notable key changes that would impact U.S. life insurers include aspects relating to a simplified life reserve adjustment, tightening eligibility criteria on the inclusion of hybrid capital and debt-funded capital, and a narrower definition of policyholder capital that is eligible for inclusion in TAC. The life reserve adjustments include liability adjustments to reflect current interest rates and adjustments to equity for life insurers when there are mismatches between balance-sheet valuations of assets and liabilities. One potential positive change to insurers is that up to 100 percent of the difference between reported life reserves and the economic reserve can be included in the adjusted common equity (ACE), subject to an independent third-party review. In this article, we will not stretch to cover the full details of the changes on the TAC side, but it may be worthwhile for interested parties to review more when considering the overall impact of the proposed S&P Global capital framework.
Conclusion
S&P Global’s proposal brings comprehensive changes to the current capital adequacy model and will have lasting impacts to insurers depending on their existing risk profile. Impacts include increased capital charges across most of the risk categories with added importance placed on the effectiveness of a company’s ALM strategies. On the other hand, some of these impacts may be offset by lower charges for other risk types, in particular on long-duration bond charges and longevity risk charge, and the greater diversification benefits that have been awarded both within and across the risk categories. As S&P Global’s capital model is officially finalized and adopted, insurers are encouraged to assess their own internal impacts and find the need to take actions to optimize their risk profile to maintain their target rating in comparison to the existing model.
Click this link to see the Appendix to this article.
Statements of fact and opinions expressed herein are those of the individual authors and are not necessarily those of the Society of Actuaries, the editors, or the respective authors’ employers.
Yiru (Eve) Sun, FSA, MAAA, Ph.D., is a managing director at Aon. She can be reached at Eve.Sun@aon.com.
John Choi, FSA, CERA, is a consultant at Oliver Wyman. He can be reached at John.Choi@oliverwyman.com.
Seong-Weon Park, FSA, MAAA, is a principal at Oliver Wyman. He can be reached at SeongWeon.Park@oliverwyman.com.