
IFRS 17 Earnings Emergence: Through the Risk Adjustment Looking Glass
By Jack Zheng, Joy Zhang and Maya Perelman
The Financial Reporter, February 2023

We have finally reached the finish line with companies going live on International Financial Reporting Standard (IFRS) 17. The insurance industry across much of the world now pivots its focus from implementation efforts to assessing disclosed impacts of the new global standard. Understanding profit emergence in the insurance world is always tricky; even after countless dry runs, some reported financials could fall out of line with expectations. Although many of the impactful accounting elections had already been made by the IFRS 17 effective date, some elections that can be modified post-transition will affect earnings emergence. A couple of examples are the extent to which risk mitigation is applied across variable fee cohorts and the construction of the risk adjustment (RA).
IFRS 17 defines the RA as the compensation for “uncertainty in the amount and timing of the cashflows that arises from non-financial risk.” The standard does not prescribe an estimation technique. Insurance entities are to apply judgment in their choice of technique and also to which confidence level they will target the calibration. Paragraph B91 of IFRS 17 does offer further guidance and outlines five principles the RA must encompass, such as holding a higher compensation the higher the degree of uncertainty or the longer the duration of the contracts.
In this article, we explore how construction of the RA can drive income emergence patterns with an illustrative 20-year term product. We cover the following:
- Income emergence pattern under a baseline scenario; and
- Case studies of different RA designs and their impacts on projected income, particularly the RA shock lapse and post-level term (PLT) mortality assumptions
This article assumes that the reader has a basic knowledge of IFRS 17. Our analysis below is based on earnings emergence for one illustrative product; actual results will vary based on specific facts and circumstances.
Product Analyzed
For our case study, we used a prototypical 20-year level term product with annually renewable increasing premiums in the PLT period. Some key product characteristics and assumptions are provided below.
|
Key product features |
Key assumptions |
|
|
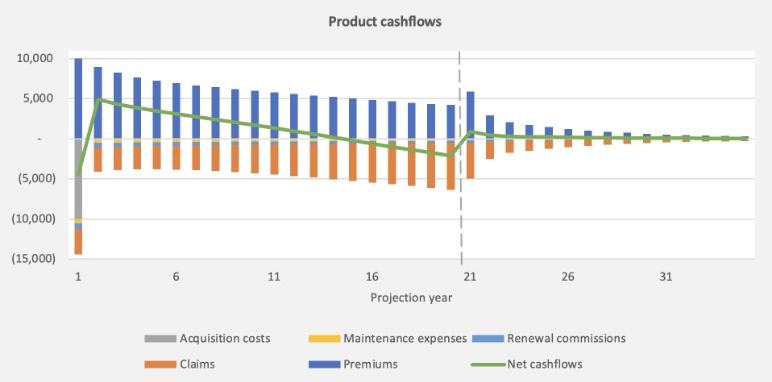
The cashflow projection as of inception is illustrated in Figure 1 below, with the vertical dashed line indicating the split between the level term and PLT periods.
Figure 1
Product Cashflows
The Case Study
Baseline Scenario
We first illustrate the earnings emergence pattern under the baseline scenario, where actual experience arises as expected over the duration of the cohort. In this illustration, the risk adjustment represents two types of non-financial risks:
- Lapse: Additional 10 percent shock lapse at the end of the level term period (90 percent instead of 80 percent).
- Mortality: Additional 7.5 percent shock during both the level term and PLT periods.
The projected net income is illustrated in Figure 2 below. As the graph shows, most of the net income is driven by insurance service results, which consist of CSM amortization and RA release. The component breakdown of the insurance service results is further illustrated in Figure 3 below.
Figure 2
Baseline Income Emergence
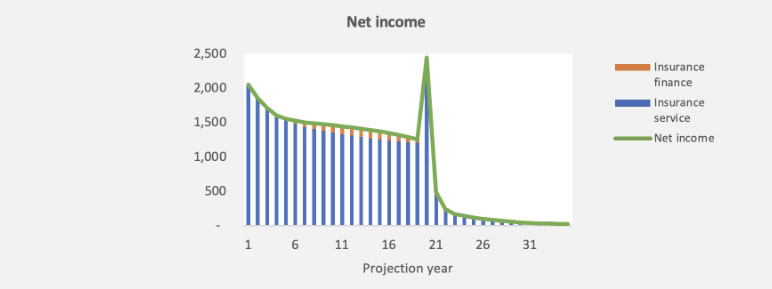
Figure 3
Breakdown of Insurance Service Results
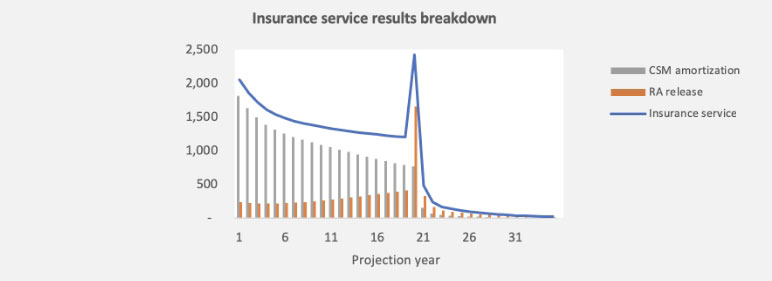
For the case study sample product, CSM amortization is based on face amount in force, which is typical for a term product. The projected face amount decreases steadily over the level term period and drops substantially at the end due to the shock lapse. Accordingly, most of the CSM is amortized during the level term period.
The RA release, however, behaves quite differently. The uncertainty captured by the RA does not end with the level term period—there is uncertainty associated with the shock lapse behavior and post-level term mortality. Therefore, the RA release is relatively lower than the CSM amortization for most of the level term period, until the large release in year 20 when the 80 percent shock lapse is realized. In comparison to the CSM amortization, the RA release is more backloaded.
Sensitivity Test 1: Shock Lapse
Our first set of sensitivity tests is around the shock lapse assumption in our RA construct. The baseline and RA assumptions are as follows:
- Baseline and sensitivity best estimate liability (BEL): 80 percent shock lapse at the end of the level term period.
- Baseline RA: 90 percent shock lapse at the end of the level term period.
- Sensitivity 1A: 100 percent shock lapse at the end of the level term period.
- Sensitivity 1B: 80 percent shock lapse at the end of the level term period.
Figure 4 below illustrates the projected net income under the baseline and each of the sensitivity scenarios.
Figure 4
RA Shock Lapse Design and Net Income
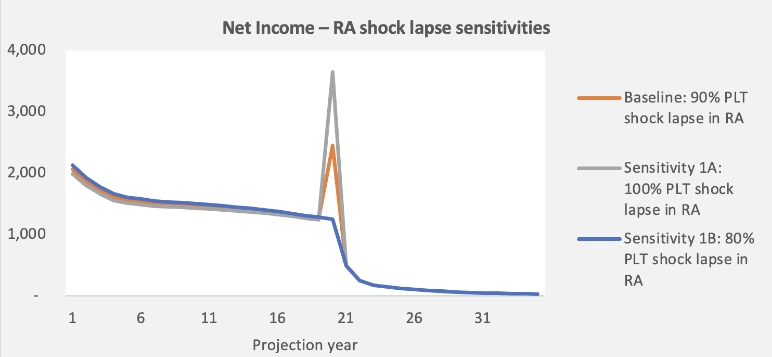
Under scenario 1A (gray line), the level of shock lapse in determining the RA increased compared to the baseline. At cohort inception, this translates into an increased RA and a decreased CSM while the BEL remains unchanged (as CSM offsets BEL and RA at inception). The smaller CSM balance results in slightly lower CSM amortization during the level term period and beyond. On the other hand, the sensitivity also leads to a much more significant RA release in year 20 at the end of the level term period. Scenario 1B shows the opposite effect.
Sensitivity Test 2: PLT Mortality
The second set of sensitivity tests adjusts mortality. We focused on the mortality assumption during the PLT period. Generally, companies have large mortality anti-selection factors applied in the PLT period to account for anti-selection risk. The RA assumptions (as a comparison to BEL) are as follows:
- Baseline RA: Additional 7.5 percent shock during both the level term and PLT periods.
- Sensitivity 2A: Additional 7.5 percent shock during the level term period, and 20 percent shock during the post-level term period.
- Sensitivity 2B: Additional 7.5 percent shock during the level term period, then in the post-level term period the mortality shock is increased by approximately 25 percent such that premiums are exactly equal to claims and expenses in that period (i.e., zero profit).
Note that in this set of sensitivities, the RA PLT shock lapse assumption remains at the baseline level of 90 percent. Impacts of the sensitivities on the income emergence are illustrated in Figure 5 below.
Figure 5
RA PLT Mortality Design and Net Income
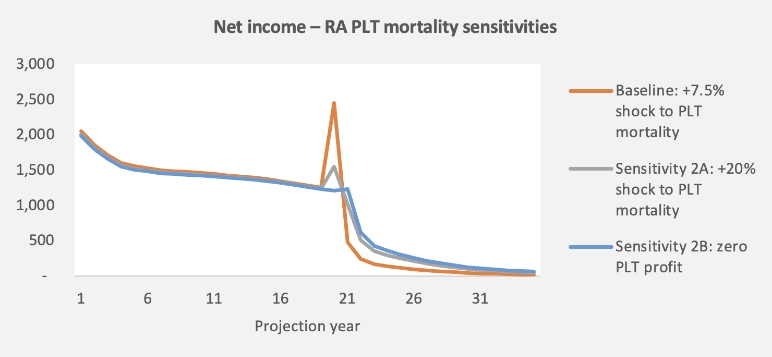
In both sensitivities, the RA increases and the CSM decreases at cohort inception. During the level term period (right before the tail end), the decreased CSM drives a slightly lower income in the sensitivity scenarios compared to baseline for a similar reason as the RA shock lapse sensitivities.
There are two effects driving the changes in pattern for both sensitivities:
- The lower PLT profitability makes the amount of the shock lapse less relevant, reducing (or eliminating) the spike in year 20.
- The higher PLT mortality in the RA assumption results in more profit in the PLT period as that higher mortality is not realized.
Concluding Thoughts
As industry-wide public disclosures under IFRS 17 are being released in 2023, companies will have a chance to observe the RA confidence levels of their peers and assess their own in comparison. As evidenced by the case study, the RA’s construction at issue can drive future income emergence and volatility. RA refinements for existing cohorts would behave similarly, with the exception of current period income effects caused by the assumption update to the extent they are not offset by the CSM. Although the focus of the case study was a term life product, similar analysis can be performed on other products to understand how the RA release generates a particular pattern of income emergence.
The backbone of any accounting policy election should be to uphold the spirit of the IFRS 17 standard. The RA is intended to reflect compensation for the cost of bearing uncertainties related to non-financial assumptions, and this design should always be made with the product’s unique risk profile in mind. As entities continue to operate under the standard’s guidance, management may wish to keep in mind that adjustments to the RA’s design will impact future income emergence.
Statements of fact and opinions expressed herein are those of the individual authors and are not necessarily those of the Society of Actuaries, the newsletter editors, or the respective authors’ employers. The views reflected in this article are the views of the authors and do not necessarily reflect the views of Ernst & Young LLP or other members of the global EY organization.
Jack Zheng, FSA, MAAA, is a consulting senior manager at Ernst & Young LLP. He can be reached at jack.zheng@ey.com.
Joy Zhang, FSA, CERA, MAAA, is a consulting senior manager at Ernst & Young LLP. She can be reached at joy.zhang@ey.com.
Maya Perelman, ASA, CERA, ACIA, is a consulting senior at Ernst & Young LLP. She can be reached at maya.perelman@ey.com.