
IFRS 17 Variable Fee Approach: Fee Income versus Total Cash Flows Point of View
By Tze Ping Chng and Ray Lin
The Financial Reporter, July 2024

The IFRS Standard for insurance contracts—IFRS 17 Insurance Contracts (IFRS 17)—has been live in many jurisdictions since the beginning of 2023. Insurance companies have put significant implementation efforts into practice and reported the financial results under the new accounting standard. Meanwhile, they have been developing and enhancing the techniques to analyze and explain the financial results; this may involve diving deeper into the rationale behind each measurement model.
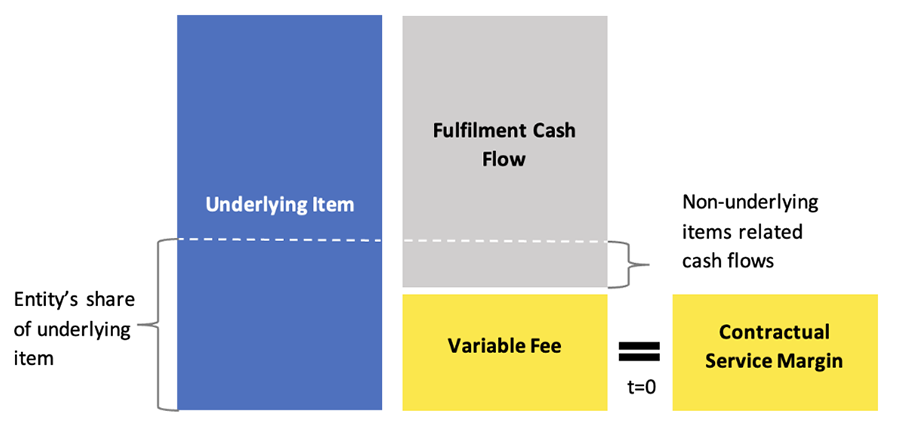
Insurance contracts with direct participation features (or direct participating contracts), where entities provide substantial investment-related services in exchange for fee charges, are measured under the variable fee approach (VFA). Given the nature of the direct participating contracts, the obligation to policyholders is essentially the fair value of the underlying items less a variable fee for service provided (see paragraph B104 of IFRS 17, as illustrated in Figure 1). The liability for remaining coverage (LRC), which is the aggregate of the fulfillment cash flows (FCF) and the contractual service margin (CSM), can be calculated either from total cash flows or fee income perspectives. While both methods result in the same outcome, the approaches offer different insights and analytical levers with varying degree of operational ease.
Figure 1
Equivalence of Fee Income and Total Cash Flows View under VFA
LRC Under Fee Income and Total Cash Flows Method
The calculations of the FCF and the CSM, are covered below.
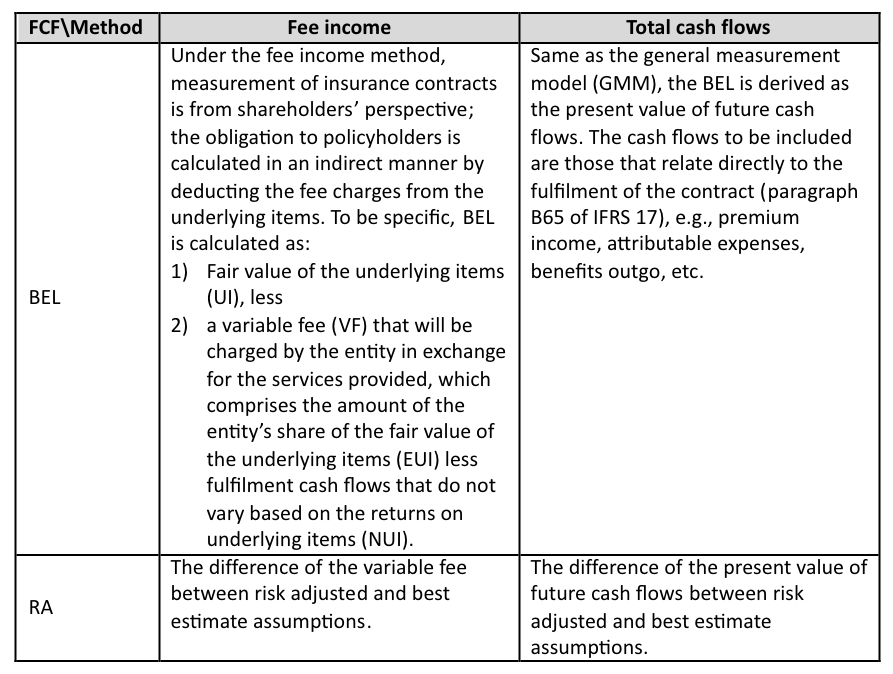
A. Fulfilment Cash Flows
The equivalence of the fee income approach and the total cash flows method is built on the fact that the entity’s share charged on the underlying items are inter-fund transactions, i.e., the outflow from the underlying items and the inflow into the shareholder’s fund net to zero. This implies that the cash flows through the underlying items less the variable fee (fee income view), where the charges of the entity’s share are embedded in both the underlying items and variable fee and hence offset each other, equal to the cash flows to policyholders for fulfilling the contracts (total cash flows view). Table 1 below describes the calculation of FCF, which includes the best estimate liability (BEL) and a risk adjustment for non-financial risk (RA).
Table 1
FCF under Fee Income and Total Cash Flows Method
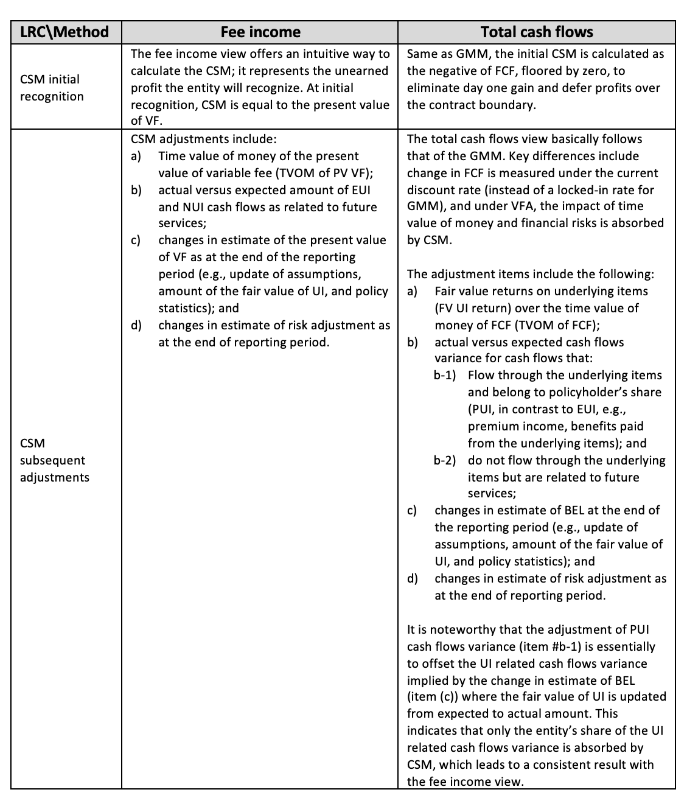
B. Contractual Service Margin
For direct participating contracts, the change of the carry amount of the CSM between successive reporting periods includes the following items:
- Effect of new contracts added to the group;
- adjustment of CSM to absorb the change of FCF relating to future services;
- amortization of CSM, which is recognized as revenue; and
- effect of currency exchange differences.
The calculations for the CSM amortization and currency exchange differences (item #3 and #4 above) are the same under the two methods. The derivation of new contracts’ CSM at initial recognition and CSM adjustment on subsequent measurement (item #1 and #2 above) will be the focus of the paper, which is detailed in Table 2 below.
Table 2
CSM Initial Recognition and Subsequent Adjustment under Fee Income and Total Cash Flows Method
Numerical Example
A simple five-year VUL is used to illustrate the derivation of the statement of financial performance under both fee income and total cash flows methods. The following summarizes the fact pattern and working assumptions, with projected account value (AV) and cash flows as at inception shown in Table 3. To cast light on the linkage between the fee income and total cash flows method, the classification of cash flows is shown in Table 4. Table 5 demonstrates the calculation of CSM at inception.
- Level annual premium = 1,000.
- Death Benefit = fixed 1,000 (SA) + AV.
- Maturity Benefit = AV.
- Premium loadings of 60%, 20%, 10% charged in the first three years.
- Cost of insurance (COI) charge is 0.2% of net amount at risk (NAAR) per year.
- Surrender charge is 10% of AV.
- 1,000 identical policies issued.
- AV is identified as the underlying item.
- Cash surrender value (CSV) is a non-distinctive investment component (NDIC).
- For simplicity, RA is ignored. All expenses are attributable expenses and are for maintenance of the policies. The number of policies is the proxy of coverage unit.
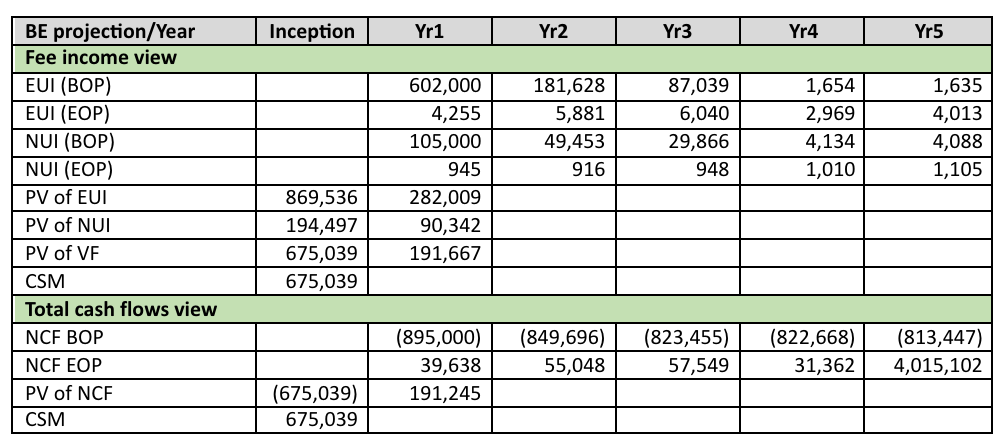
Table 3
Projected Cash Flows and AV at Inception
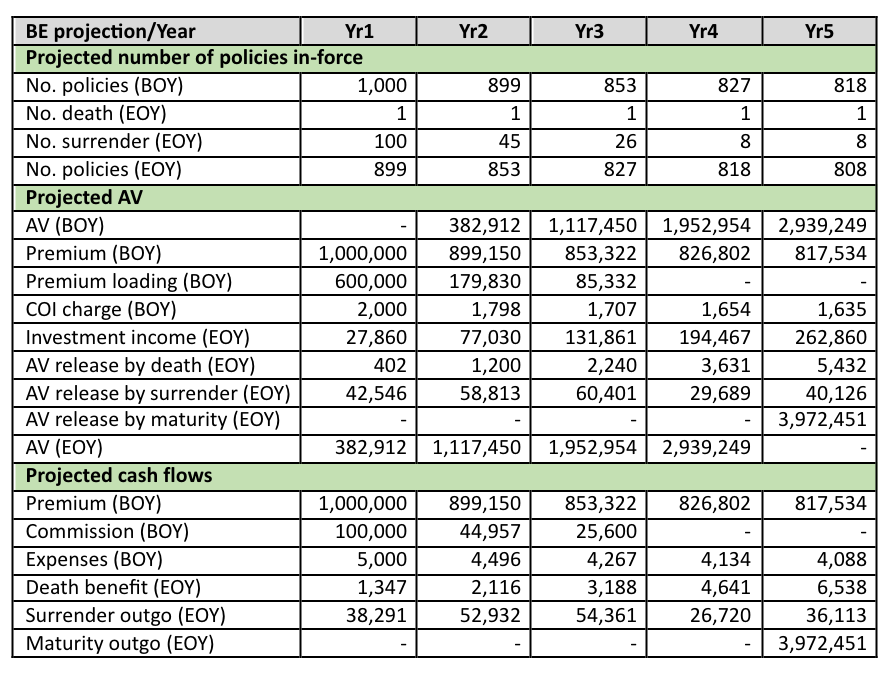
Note: due to rounding, numbers may not add up.
Table 4
Classification of Cash Flows in Fee Income and Total Cash Flows View

Table 5
CSM at Initial Recognition
In Year 1, actual experiences deviate from expected, and assumptions are updated accordingly. Table 6 shows the projected AV and cash flows at the end of Year 1 after true-up to the actual experiences and updating assumptions. CSM roll-forward and income statement for the reporting period of Year 1 are summarized in Table 7 and Table 8. The key items are highlighted with explanations noted below:
- Under the fee income view, the actual VF is lower than expected due to fewer than expected surrenders, hence lower surrender charge; it is offset by the higher-than-expected PV of VF at the end of Year 1 due to higher actual number of policies in-force and fund return, which collectively impact the CSM favorably.
Under the total cash flows view, the positive cash flows variance is mainly driven by a lower surrender outgo which outweighs the unfavorable impact from the difference between actual and expected FCF at the end of Year 1. - CSM amortization is equal to the product of CSM (after adjustment) and the amortization ratio, which is calculated by the number of policies in Year 1 divided by the PV number of policies over all future years, i.e., 13%.
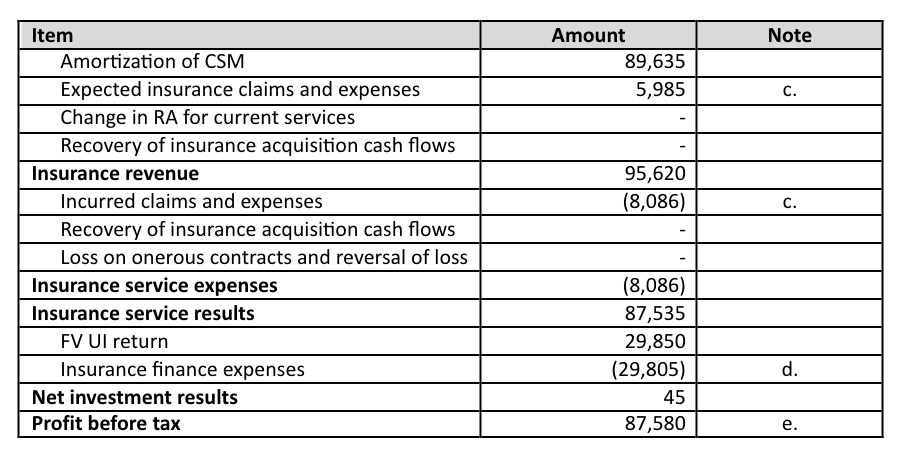
- Insurance claims is equal to death benefit (SA+AV) less NDIC (CSV). Higher actual death rate and expenses lead to unfavorable impact on insurance services results.
- Insurance finance expenses is FV UI return, i.e., investment return on AV (in this example), with an adjustment of actual versus expected variance for the non-NDIC claims paid from UI (AV less CSV). The adjustment is to reflect the fact that cash flows paid from UI essentially have no impact on net profit given they affect asset (through UI) and liability (through LRC) by the same amount. According to the insurance service result presentation requirements (paragraph 83 and 84 of IFRS 17), claims over NDIC shall be presented in insurance service result, hence the same amount (only those from UI) with opposite sign needs to be presented in another line (insurance finance expenses in this example) to offset the impact.
- Profit before tax is the sum of insurance service results and net investment results, which is mainly driven by CSM amortization and claims/expenses variance of the amounts on top of UI.
Table 6
Projected Cash Flows and AV as at the end of Year 1 (Values in Yr1 are Actual Experiences)
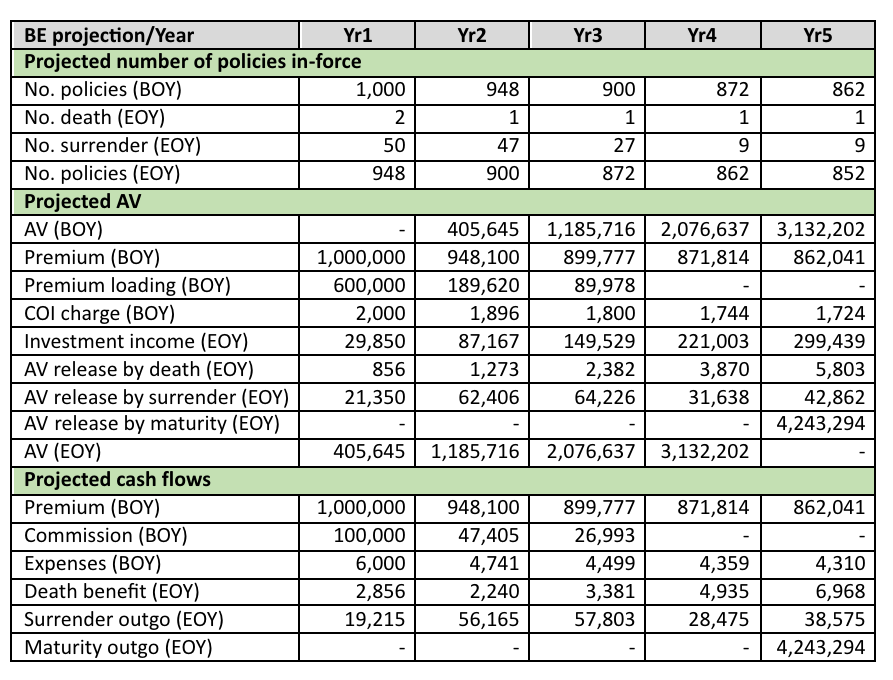
Table 7
CSM Roll-forward in Year 1
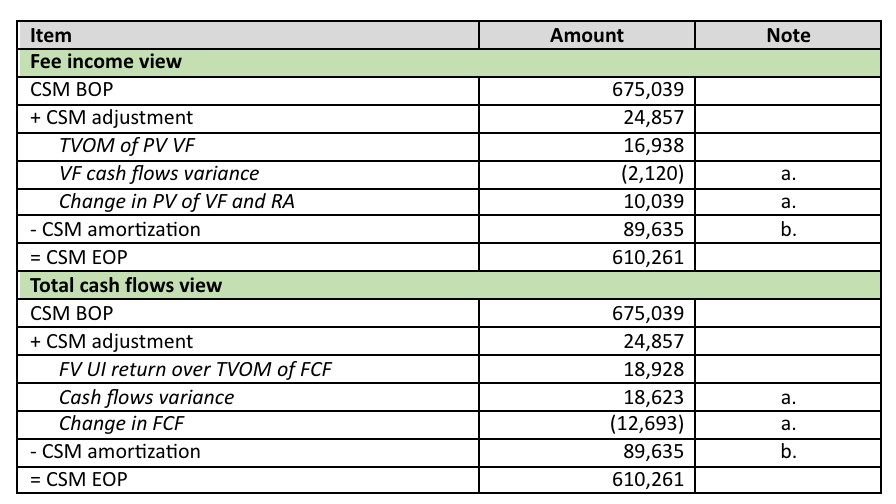
Table 8
Income Statement in Year 1
Conclusion
The valuation of direct participating contracts can be implemented based on either the fee income or total cash flows methods. The fee income method is more intuitive and lends itself to analytical insight. The total cash flows method is operationally feasible as the LRC roll-forward step is similar to that under GMM (except for the major differences noted above); the roll-forward components can be leveraged in preparing the statement of profit and loss (given the items presented there are cash flows rather than fee income). Although most insurers only implemented one method in their system, it would be helpful to consider the other method that could serve as a validation mechanism and contribute to effective results analysis.
Statements of fact and opinions expressed herein are those of the individual authors and are not necessarily those of the Society of Actuaries, the newsletter editors, or the respective authors’ employers.
Tze Ping Chng, FSA, MAAA, is a partner at Ernst & Young Advisory Services Limited in Hong Kong. He can be contacted at tze-ping.chng@hk.ey.com.
Ray Lin, FSA, is an assistant vice president at Nan Shan Life in Taiwan. He can be contacted at ray.lin.0209@gmail.com.