
Comparing Model Error Between a Standard Risk Adjustment Model and a Disease-Specific Risk Adjustment Model
By Andrew Mackenzie, Elaine Zhao, Ian Duncan, and Jiaming Wang
Health Watch, December 2020

The pursuit of value-based care as a consequence of health care reform laws such as the Affordable Care Act (ACA) and the Medicare Modernization Act has accelerated the use of risk adjustment. Payers, providers and health intervention vendors may underestimate the extent to which model error influences risk adjustment results. “Model error” is a measure of the difference between the predicted quantity and the actual quantity. These model error differences are caused by stochastic variance in the underlying health care quantities being compared. Model error is reduced with volume, but can be significant when the sample size is small or the population has large variations in costs.[1] In practice, model error can result in a positive savings calculation for a program that in fact has not generated savings, or a significantly higher or lower savings amount than the true (unobserved) savings. Risk adjustment and other forms of population standardization approaches such as propensity matching are applied to reduce population differences and increase comparability; however, residual model error after the application of risk adjustment models and propensity matching persists. In fact, these models bring their own inherent variations, which introduce additional sources of model error and could even increase the potential magnitude of aggregate model error. Risk corridors are frequently used to mitigate this error in practice, but many risk corridors may be insufficient to fully account for model error especially for small sample sizes, specific disease groups and populations with high cost variance.[2]
Risk adjustment models are typically constructed on the experience of an entire population rather than on the experience of members appropriate for a specific disease management intervention. As such, we hypothesize that a population-based risk adjustment model will have greater model error (be less accurate) than a risk adjustment model constructed from the experience of an intervention-specific member cohort. However, in the market we observe a significant lack of disease-specific risk adjustment models used in program evaluations despite a proliferation of disease-specific health care interventions and programs.
To understand the potential differences in error between a standard risk adjustment model and a disease-specific risk adjustment model, we developed a claims-based risk adjustment model for individuals with type 2 diabetes and compared its predictive accuracy to the publicly available Department of Health and Human Services Hierarchical Condition Category (HHS-HCC) risk adjustment model.[3] We applied both risk-scoring models to the same sample of members with type 2 diabetes from the 2016 IBM MarketScan database[4] and evaluated standard measures of fit such as R-squared and mean absolute error (MAE) statistics. This approach is consistent with previous Society of Actuaries (SOA) studies comparing the accuracy of risk-scoring models.[5] In addition, we performed bootstrapping to simulate pairs of member cohorts to evaluate how well each model performed when applied to various population sizes.
We found that the type 2 diabetes risk model was significantly more accurate than the HHS-HCC risk model when predicting claims expenditure risk for members with type 2 diabetes. At the individual level, the diabetes risk model had a 47 percent higher R-squared (54 percent vs. 37 percent) and a 14 percent lower MAE (65 percent vs. 75 percent) compared to the HHS-HCC model. When used to risk adjust group-level spend, the diabetes risk model produced confidence intervals that were consistently 14 percent to 17 percent smaller than the HHS-HCC model for all sample sizes tested. Such differences in model accuracy could be the difference between correctly determining whether a program is financially successful or not.
METHODOLOGY
The HHS-HCC Risk Adjustment Model
In 2014, the Centers for Medicare and Medicaid Services (CMS) and RTI International developed the HHS-HCC risk adjustment model for individual and small group markets under the ACA. The HHS-HCC risk adjustment model is a concurrent regression model that predicts medical and drug expenditure risk using diagnoses and demographics for commercially insured enrollees. For an enrollee within a particular age group and in a given ACA metal tier plan, the HHS-HCC model predicts plan liability expenditure through factors such as age, sex, HCC and disease interaction coefficients.[6] Predicted plan liability expenditures are then converted to relative plan liability expenditures with an average value of 1 within the respective sample.
The HHS model was initially constructed using the 2010 IBM MarketScan database.[7] The following criteria were applied to include only enrollees who satisfied these requirements:
- had at least one month of enrollment in the current year,
- were enrolled in a PPO or FFS health plan,
- had no payments made on a capitated basis,
- had prescription drug coverage and
- had integrated mental health/substance abuse coverage.
For each benefit year, CMS makes annual updates to the model methodology and recalculates the model factors by using more recent claims and enrollment data. Since 2016, CMS has provided annual CPT/HCPCS procedure code updates and limits the model to only include ICD-10-CM diagnosis codes from appropriate sources for risk adjustment.
In this study, we applied the 2016 HHS-HCC Platinum model to predict plan liability expenditure for all members.[8] Since the model converts plan liability expenditure to a relative basis and normalizes the population mean relative liability expenditure to 1 for models under all metal levels, we expect any other plan assumptions to yield similar accuracy measures to those reported in our results.
Type 2 Diabetes Identification
Our study population consists of members with type 2 diabetes extracted from a 3.4 million-member sample from the IBM Marketscan database.[9] The diabetes identification logic is included in the Appendix at the end of this article.
We also applied the HHS-HCC model’s member exclusion criteria as described in the previous section for consistency with the HHS-HCC model’s selection rule.[10] The exclusion criteria eliminated approximately 28 percent of type 2 diabetes members. The final selected dataset comprised 107,526 (3.15 percent) of the overall 2016 population.
The Type 2 Diabetes Risk Adjustment Model
Santa Barbara Actuaries Inc. (SBA) developed the type 2 diabetes risk adjustment model to appropriately stratify diabetes risks using a combination of medical, pharmacy, demographic and financial variables. The model is a concurrent linear regression model that predicts per member per month (PMPM) allowed cost. Key factors of the risk adjustment model include diagnosis groups (taken directly from the HCCs without manipulation), pharmacy group indicators, member demographics (age and gender) and total cost from the previous benefit year.
While the diabetes risk model predicts allowed cost and the HHS-HCC model predicts plan liability, it is important to note that the evaluation of HHS-HCC model performance is not based on actual plan paid amounts. Rather we applied standard plan designs to the allowed amounts and calculated what the plan liability would have been under different metal tiers’ cost-sharing structures. This is consistent with the approach taken by CMS and RTI International during the development and evaluation of the HHS-HCC model.[11] Hence, the difference in the predicted metrics does not subject either model to additional amounts of variation attributable to plan design impacts.
Measures of Individual-Level Prediction Accuracy
We report R-squared and mean absolute error (MAE) metrics for each model. R-squared measures the percentage of model variation in the dependent variable that is explained by the specified model. R-squared is calculated as follows:
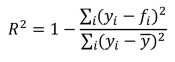
where 𝑓𝑖 is the prediction for observation i and 𝑦𝑖 is the actual observation for observation i.
MAE is defined as the mean of the absolute differences between each predicted value and the actual value over all observations. The formulaic representation is as follows:
![]()
where |𝑒𝑖| = |𝑓𝑖 - 𝑦𝑖| is the absolute error for observation 𝑖 and 𝑛 is the total number of observations. In this article we express MAE as percentages to allow for comparison between the models. This was done by dividing the actual (nominal) MAE by the mean plan liability for the HHS model or by the mean allowed for the diabetes risk model.
Bootstrapping and Confidence Intervals
No risk adjustment model perfectly predicts individual costs. We use the term “model error” to refer to the difference between actual and predicted expenditures after risk adjustment. Bootstrapping is a commonly used resampling technique to evaluate and assign measures of accuracy to statistical models.[12] One approach is to apply the statistical model to different subsets drawn at random from a population that is assumed to be identically and independently distributed (iid), and then repeat the sampling process many times over. The multitude of samples allows for the quantification of model error and the construction of empirical confidence intervals.
In this study, we simulated two randomly selected groups of members (to proxy a control group and a study group) 1,000 times for each sample size of 200, 500 and 1,000. Taking sample size 200 as an example, we first sampled 400 members at random from the MarketScan type 2 diabetes population of 107,526. These 400 members were then split into two groups of 200, and their aggregate costs during the 12-month period were compared. We then repeated the sampling process 1,000 times. Since these members were selected at random from an iid data set, the difference in aggregate costs between the two groups is due to underlying differences in risk. After applying a perfect risk adjustment model, one should find zero difference in cost between the two sample groups in every simulation.
Because we are not working with a perfect risk adjustment model, we will frequently find differences in estimated costs between each sample after applying the risk adjustment models. To understand the magnitude of the model error, we rank order the 1,000 simulations by the size of the difference in the risk-adjusted allowed amounts. This allows us to create values at risk (VaR) and conditional tail expectation (CTEs) whereby we can quantify the size of model error at any percentile (i.e., confidence level). The difference between the 97.5th percentile and the 2.5th percentile was defined as the 95 percent confidence interval with 95 percent of simulated outcomes falling within this range. Likewise, 50 percent of the simulated outcomes fall within the 50 percent confidence interval.
RESULTS
Accuracy of Individual-Level Risk Prediction
Table 1 presents the R-Squared and MAE for each tested model using allowed costs censored at $250,000 for an individual to limit the influence of extreme outliers.
Table 1
Model R-Squared and MAE
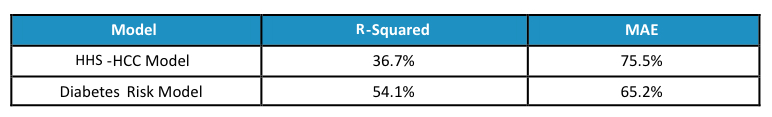
The higher R-squared and lower MAE from the diabetes risk model shows the much stronger individual level predictive power produced by the diabetes risk model.
Accuracy of Group-Level Risk Adjustment
Since risk models are generally used to risk-adjust the average expenditure for a group of insured members, an assessment of the models’ performance in this regard will be more insightful than the individual level fit statistics described above. For each sample size of 200, 500 and 1,000 members, we randomly selected 1,000 pairs of groups and within each pair compared the difference between the two group’s resulting PMPMs after dividing the actual PMPMs by each group’s average risk score. The differences are expressed as a percentage of the type 2 diabetes population average PMPM.
To establish a baseline for the degree of fluctuation in population costs and how it varies with volume, we simulated the 95 percent, 75 percent and 50 percent confidence intervals as well as MAEs at each sample size. Results are shown in Table 2.
Table 2
Empirical Results—No Risk Adjustment
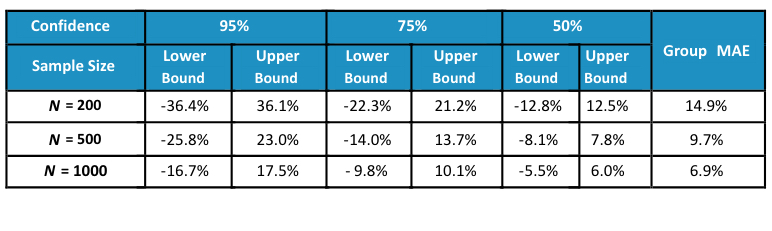 When no adjustment is made to normalize for differences in demographics and health status between different groups of type 2 diabetes members, large variations in group average costs exist. For example, 95 percent of the time the average PMPMs of two groups of 200 members with type 2 diabetes can be off by around 36 percent of the population average spend. Even at a sample size of 1,000 members, the 95 percent confidence interval still reveals a 17 percent difference between the two group’s costs.
Table 3 presents the results from risk adjusting group average costs using risk scores produced by the HHS-HCC model.
Table 3
Empirical Results—Risk Adjustment Using HHS-HCC Model
As illustrated, confidence intervals for all sample sizes and confidence levels are narrower after applying risk adjustment. The MAEs at each sample size are also approximately 20 percent smaller.
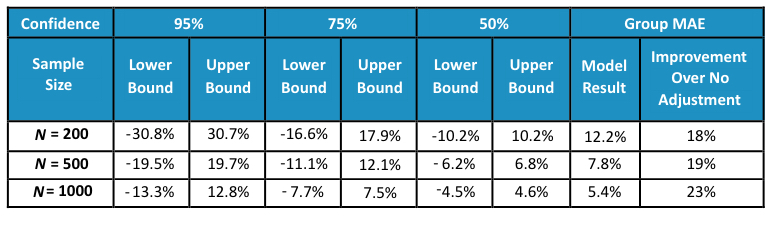
Finally, we present results from the diabetes risk model in Table 4.
Table 4
Empirical Results—Risk Adjustment Using Diabetes Risk Model
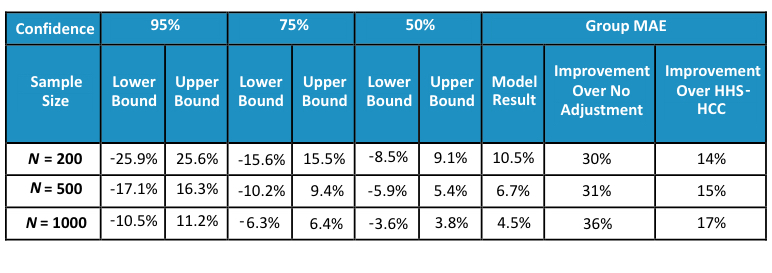
The diabetes risk model further narrows the confidence intervals and reduces the MAEs compared to the HHS-HCC model. The MAEs improve by more than 30 percent compared to the no adjustment baseline and by more than 14 percent compared to the HHS-HCC model.
DISCUSSION
Disease-specific health care interventions and programs are often evaluated with standard risk adjustment models or using more simplistic differences-in-differences approaches that are not customized for the target population. As demonstrated above, the use of standard risk adjustment models leads to significant model error. Using models specifically constructed for the target health condition population rather than a model constructed for the general population reduces the magnitude of the model error. Since model error can lead to inappropriate outcomes evaluation determinations (e.g., suggesting an intervention resulted in medical cost savings when no true savings are generated), it is important for actuaries and health economists to be aware of model error and the opportunity for improvements in accuracy of outcomes that can result from the application of a customized risk adjustment model.
LIMITATIONS
In reproducing the actual values of the relative plan liabilities using the HHS-HCC model risk scores we followed the general guidelines offered in the model development documentation published by RTI International.[13] However, the documentation did not describe in detail certain assumptions including the expected membership distribution across metal tiers and standard plan designs for each tier. Thus, we used the actual membership distribution in 2016,[14] and standard plan designs published by HHS.[15]
In practice, confidence intervals produced through similar bootstrapping techniques are expected to be narrower if sample members are drawn from the same plan or geography, which our simulations do not consider.
IBM Disclaimer: Certain data used in this study were supplied by International Business Machines Corporation. Any analysis, interpretation or conclusion based on these data is solely that of the authors and not International Business Machines Corporation.
This analysis was conducted independently by the authors with funding provided by Onduo LLC, Newton, Massachusetts.
APPENDIX: DIABETES IDENTIFICATION LOGIC
The following diabetes identification logic was applied to identify members with diabetes:
- members who had at least one facility claim from inpatient, skilled nursing or hospice associated with an ICD-10 diabetes diagnosis code OR
- members who had at least two outpatient facility or professional claims on two different dates associated with an ICD-10 diabetes diagnosis code OR
- members with at least one diabetes drug NDC prescription with over 60 days of supply in a 12-month period.
Members with claims for both type 1 and type 2 diabetes are identified as having type 1 diabetes (and excluded) if they have more frequent type 1 diabetes claims. All medical and pharmacy claims for members identified with type 2 diabetes were extracted. Our type 2 diabetes sample consisted of 148,533 (or 4.35 percent) of our overall 2016 population.
Andrew Mackenzie, FSA, MAAA, is a managing director and consulting actuary with Santa Barbara Actuaries. He can be reached at amackenzie@sbactuaries.com.
Elaine Zhao, ASA, MAAA, is an actuarial consultant with Santa Barbara Actuaries. She can be reached at ezhao@sbactuaries.com.
Ian Duncan, PhD, FSA, FCA, FCIA, FIA, MAAA, is an adjunct professor of actuarial statistics at the University of California, Santa Barbara. He can be reached at duncan@pstat.ucsb.edu.
Jiaming Wang, MS, is an actuarial analyst with Santa Barbara Actuaries. He can be reached at jwang@sbactuaries.com.