
Claims Reserve Margin in the Health Annual Statement: A Review of 2016–2021
By Robert Lang and Elliot McLeRoy
Health Watch, November 2023

Appointed actuaries are required to opine on the adequacy of reserves held in the year-end financial statement. In preparing claims reserves in the annual statement, health insurers and their opining actuaries will generally include a provision for adverse deviation (PAD) in their reserved amount to satisfy language both in the National Association of Insurance Commissioners (NAIC) Health Annual Statement Instructions and in Actuarial Standards of Practice. More specifically, the NAIC instructions state that for an unqualified opinion,
the amounts carried in the balance sheet . . . make a good and sufficient [emphasis added] provision for all unpaid claims and other actuarial liabilities of the organization under the terms of its contracts and agreements.[1]
Actuarial Standard of Practice (ASOP) 28 expands further on the NAIC instructions by stating:
In order to issue such actuarial opinion that uses the language “good and sufficient,” the actuary should determine that the assets and liabilities are sufficient to cover obligations under moderately adverse conditions and be satisfied that the actuarial judgments made give recognition to any relevant factors, including the time periods over which the assets and liabilities will extend.[2]
Thus, ASOP 28 provides some latitude in professional judgment in determining the levels of provision for adverse deviation to be included in the reserve estimates to cover “moderately adverse conditions.”
While it is not possible to distinguish the explicit PAD from the implied conservatism in incurred but not paid (IBNP) estimates from historical, available data, we can calculate the total ultimate margin in the claims reserve estimates that occurred by comparing original booked estimates to actual claim runout. Unless otherwise stated, “PAD” and “margin” are used interchangeably throughout this article to indicate the sum of explicit and implicit conservatism in the reserve estimate.
This article explores the total level of margin (both implicit and explicit margin combined) included in the reported claims reserves by examining NAIC filing data from 2016 through 2022.
We also summarize the range of unpaid claims adjustment expense (CAE) as a percentage of the unpaid claims reserve, since this is readily available as a separate line item in the annual financial statements.
Summary of Results
The results in Table 1 come from the S&P Global Market Intelligence database of NAIC filings and represent five-year averages (excluding 2020) of the quartiles, averages and weighted averages of the PADs by block of business. For example, the Dental Only, 25th percentile cell (0.2%) is calculated by taking a simple average of companies in the 25th percentile of margin percentages from 2016 through 2019 and 2021 for dental blocks of business.
From Table 1, the margin levels, as determined through restated claims levels, vary considerably both by block of business and within a block of business. The differential between the 25th and 75th percentiles is the lowest for Vision Only (2,000 basis points) and highest for Medicare (3,800 basis points).
Table 1
Five-Year Average Margins at Varying Percentiles by Block of Business
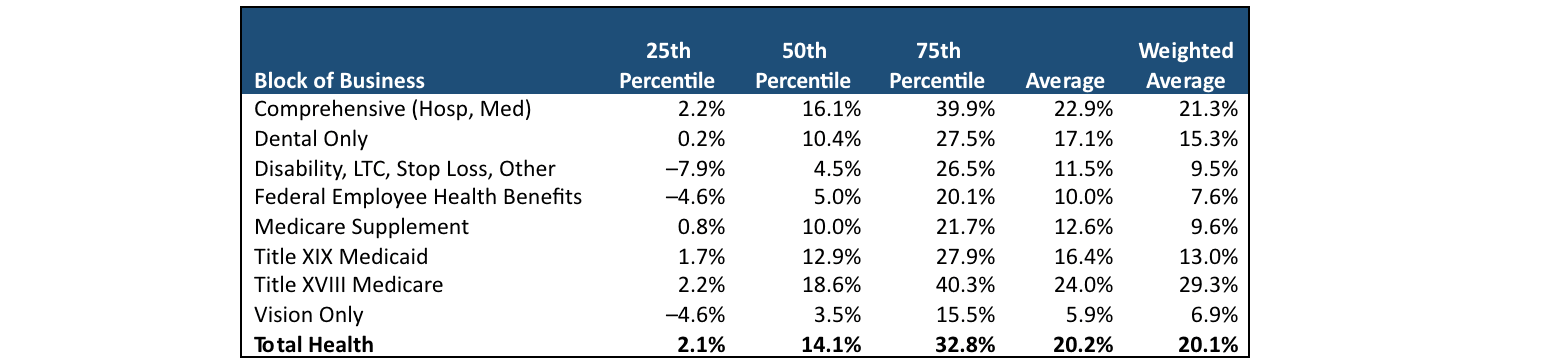
Source: S&P Global Market Intelligence; data from all health insurers’ annual reports.
For the larger blocks representing traditional health insurance (Comprehensive, Medicare and Medicaid), the average margin fluctuates from around 12.9 percent to 18.6 percent at the 50th percentile. The range in margin is even greater when measured by the member-weighted average, varying from 13.0 percent to 29.3 percent and implying that larger companies tend toward higher margins than smaller companies. Additionally, of those three blocks, Medicare has the largest differential between the 50th percentile results and the weighted average (18.6% versus 29.3%). Other blocks seem to have more nuanced, block-specific patterns in their margin levels, but in general, they all have lower margin levels at each quartile compared to the three traditional blocks.
Table 2 shows the five-year average of member month–weighted averages for each combination of block of business and size of those blocks as determined by member months (MMs). For example, the smallest cell (20.7%) of Dental Only is calculated by taking a simple average of the member month–weighted average margins from 2016 through 2019 and 2021 for dental blocks of business with less than 100,000 MMs.
Table 2
Five-Year Average of the Weighted Average Margins at Varying Block Sizes
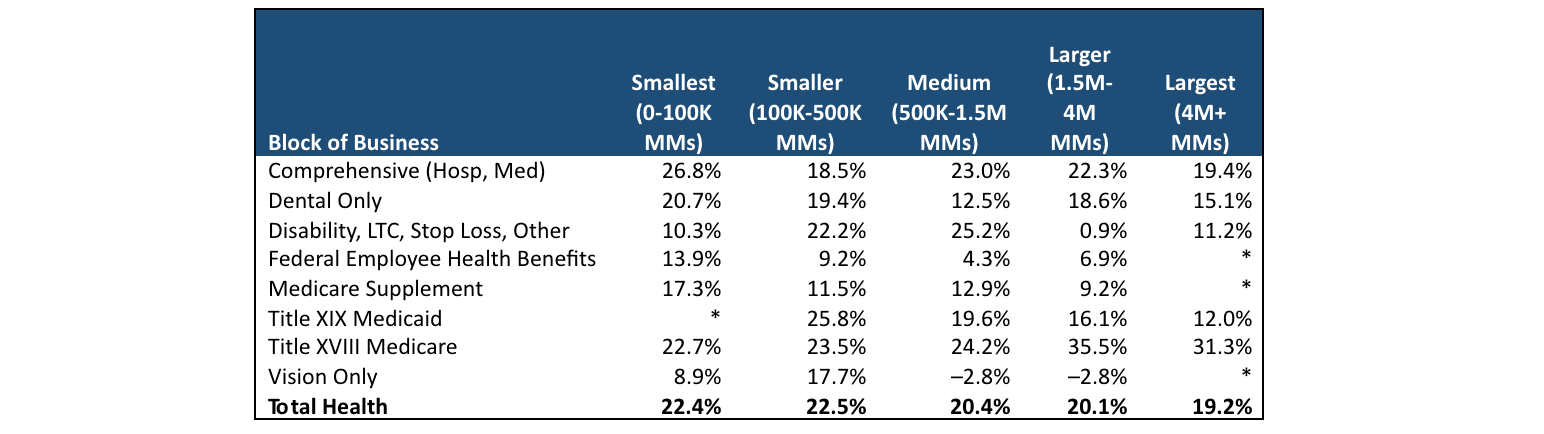
* Data are not reported due to a low number of reporting entities in select cells of the table.
Source: S&P Global Market Intelligence; data from all health insurers’ annual reports.
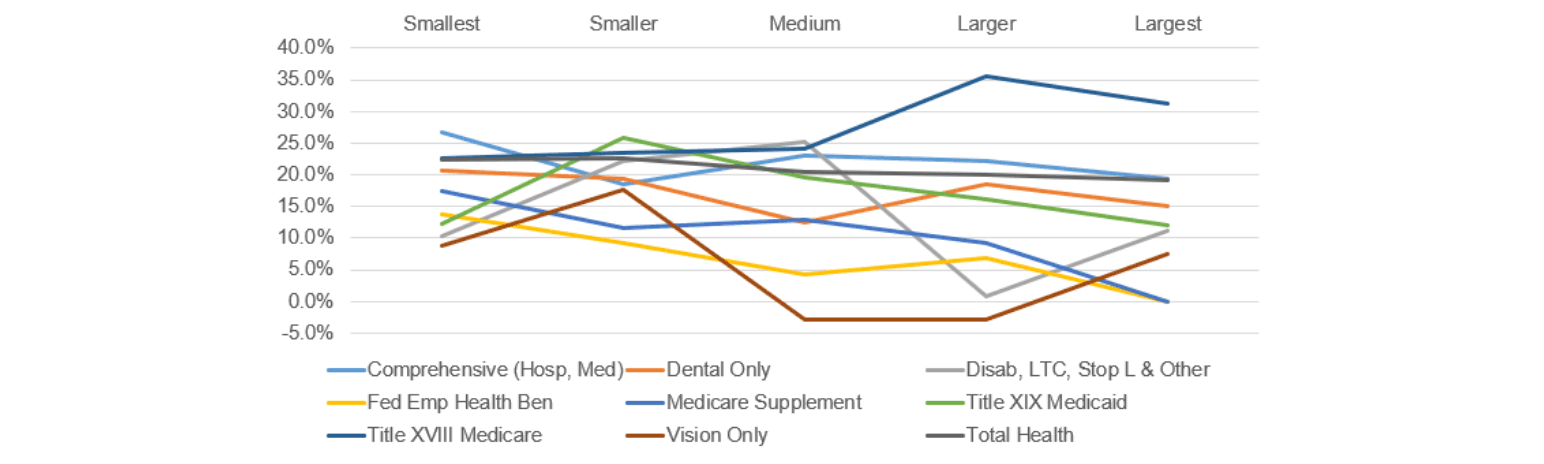
As a general rule of thumb, we would expect margin levels to decrease with increasing block size within a given block of business category. This is because larger blocks of business should theoretically have less volatility and therefore lower PAD levels (as a percentage). What we see in Table 2 is that while this expectation holds true to some degree, there are numerous examples where this isn’t the case, and at least for the Medicare and Disability blocks, the opposite is seen. We’ve used the information from Table 2 to create Figure 1 to provide a more visual look at the results.
Figure 1
Five-Year Average of the Weighted Average Margin at Varying Block Sizes
We also reviewed CAE as a percentage of total unpaid claim reserve. Unlike the results shown in Tables 1 and 2, the CAE analysis is not a lookback comparison of results. It is a report of the CAE booked in the financial statement and does not evaluate the adequacy of the CAE that is booked. Table 3 presents those results by company size. As with the earlier tables, 2020 is excluded from the five-year average.
Table 3
Five-Year Average CAE at Varying Percentiles and Block Sizes

Source: S&P Global Market Intelligence; data from all health insurers’ annual reports.
There are two main observations with the CAE results. First, unlike PAD, there isn’t a lot of variation across the industry as a whole. We can see in the table that CAE, as a percentage of initial booked unpaid claim liabilities, generally ranges from about 1.0 percent up to about 3.0 percent with some outliers below and above that range. Second, we observe that the CAE percentage generally increases with company size. The increasing CAE percentage may be because companies devote increased administrative efforts to reviewing and negotiating claims as size increases. Therefore, additional funds would need to be held for administrative costs related to adjudicating the unpaid claims liability compared to those of smaller organizations.
Note that CAE is not available by block of business.
Comparison to Year-end 2020
The results shown in the preceding section are summaries from 2016 through 2019 and 2021. The year 2020 is intentionally excluded due to the extraordinary circumstances surrounding COVID-19 and how organizations adjusted their margin policy to the unusual situation. That said, it is interesting to review how companies on the whole adjusted their conservatism in their year-end financial statements in response to COVID-19.
Like Table 1, Table 4 reports the quartiles, averages and weighted averages of the PADs by block of business. With some exceptions, the margin percentages in 2020 are materially higher than those from prior years. The majority of results in Table 4 materially exceeds the PAD levels from their prior year counterparts (Table 1), with many cells being 500 basis points or more higher. The overall weighted average from the prior years was 20.1 percent compared to 23.1 percent in 2020 (a 14.6% increase).
Table 4
2020 Margins at Varying Percentiles by Block of Business
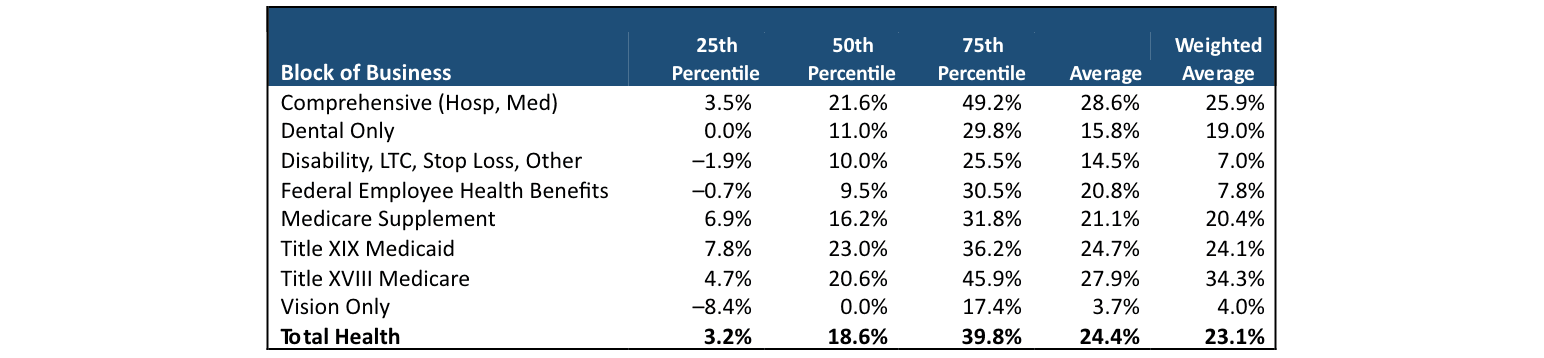
Source: S&P Global Market Intelligence; data from all health insurers’ annual reports.
Data and Methodology
To perform the analysis, we used S&P Global Market Intelligence to collect data for all organizations filing the NAIC Health Annual Statement (the Orange Blank). The prior year’s claim liability is restated in the next year’s annual statement, which provides the opportunity to evaluate the overall levels of conservatism (or lack thereof) that was built into the estimation of the claim liability.
Using S&P Global Market Intelligence, it is possible to aggregate multiple years of information. We pulled six years of financial information together (2016–2021) for all organizations filing the Orange Blank. We aggregated information at the block of business level where it was available. Specifically, we extracted information from each company’s “Underwriting and Investment Exhibit, Part 2B—Analysis of Claims” for information regarding the statement year’s estimate of unpaid claims and the prior year’s restatement of unpaid claims. We pulled data from page 3, line 3, to analyze CAE percentages. Lastly, we pulled membership information by block of business from the “Exhibit of Premiums, Enrollment and Utilization.” Information was extracted for each company filing an annual statement and was not rolled up to the parent-organization level.
We excluded as outliers any organizations where the absolute value of the initial estimate over the restatement was greater than 150 percent. We also excluded instances where the initial estimate or the restatement indicated a negative claims reserve which mostly had an impact on the Disability, LTC, Stop Loss block. The total number of organizations varied from year to year but ranged from 733 distinct annual statements to 856 after applying the exclusions described here. We do not report any cells with less than 10 organizations represented so as not to misrepresent the information as indicative of how the industry determines margin and CAE when only a small number of companies is being reported.
Margin was determined at the organization level by dividing the reserve in a given year’s annual statement, the sum of columns 3 and 4 of the “Underwriting and Investment Exhibit, Part 2B,” by the restatement in the following year’s annual statement in exhibit 2B, the sum of columns 1 and 3. More succinctly,

CAE was determined by dividing the unpaid claims adjustment expense (line 3, page 3, liabilities, capital and surplus) by claims unpaid (line 1, page 3, liabilities, capital and surplus).
While margin can be assessed by line of business, CAE is reported only in aggregate. Both metrics were examined in total and by organization size, as determined by total member months. Margin levels were further reported by block of business and block size. The groupings were as follows:
- Smallest—less than or equal to 100,000 MMs
- Smaller—greater than 100,000 and less than or equal to 500,000 MMs
- Medium—greater than 500,000 and less than or equal to 1.5 million MMs
- Larger—greater than 1.5 million and less than or equal to 4 million MMs
- Largest—greater than 4 million MMs
Both margin and CAE were aggregated and summarized at the 25th, 50th and 75th quartiles by average and weighted average (by MMs).
Caveats
This article makes no recommendation as to the appropriateness of including PAD or whether any such guidance is consistent with local or federal rules and regulations.
The results make no recommendations as to the amount of PAD that any organization should establish in its reserve-setting process.
This analysis relied on information from the S&P Global Market Intelligence database, and we made no attempt to audit the data for accuracy. In addition, this analysis only includes S&P data for companies filing the Orange Blank. Therefore, organizations filing health claims on the Blue Blank or the California Department of Managed Healthcare Filings are not included and may represent a material portion of the insurance market.
This analysis inherently assumes that the restated claim amounts in Exhibit 2B (columns 1 and 3) are generally complete and include relatively little PAD. Results will be impacted to the extent that there are widespread, high levels of PAD incorporated into the restated estimates of prior-year unpaid claims.
Variance in margin results may be partially driven by differences in the methodology used to incorporate PAD between organizations.
Geographical variances in business operations or applicable state rules and regulations are not accounted for in the summary of results. For example, claims processing patterns may vary by region or size of the managed care organization. Additionally, certain states may have specific rules that impact the levels of PAD in the statement.
Conclusion
To reiterate, the results in this article are purely for informational purposes and should be considered only as a data point when considering and establishing margin policy within your organization. Wakely has ample experience analyzing historical claims patterns that could inform your margin policy.
Statements of fact and opinions expressed herein are those of the individual authors and are not necessarily those of the Society of Actuaries, the editors, or the respective authors’ employers.
Robert Lang, FSA, MAAA, is a senior consulting actuary at Wakely Consulting Group. Robert can be reached at robertl@wakely.com.
Elliot McLeRoy is a senior actuarial analyst at Wakely Consulting Group. Elliot can be reached at elliot.mcleroy@wakely.com.