
Issue Brief: Changing Financial Risks for Medigap Insurance, Part 1
By Kristi M. Bohn
Health Watch, March 2024

During the past few years, performance, cost and risk trends for Medicare supplement (Medigap) products have undergone substantial changes. Some of these trends could ease cost pressures on Medigap insurers, while others might increase them. Part 1 of this article discusses current changing trends and considerations about how they are impacting Medigap.
COVID-19’s Impacts
The pandemic affected health insurers, payers and patients in unexpected ways. Counter to expectations in its early days, health insurance financial performance generally improved in 2020 and 2021 (Figure 1). Much of the improvement, however, was due to the number of patients who deferred certain types of care or simply sought less care than they normally would (or should) have.
Figure 1
Health Insurance Loss Ratio Experience (Loss Ratio = Claims/Premiums)
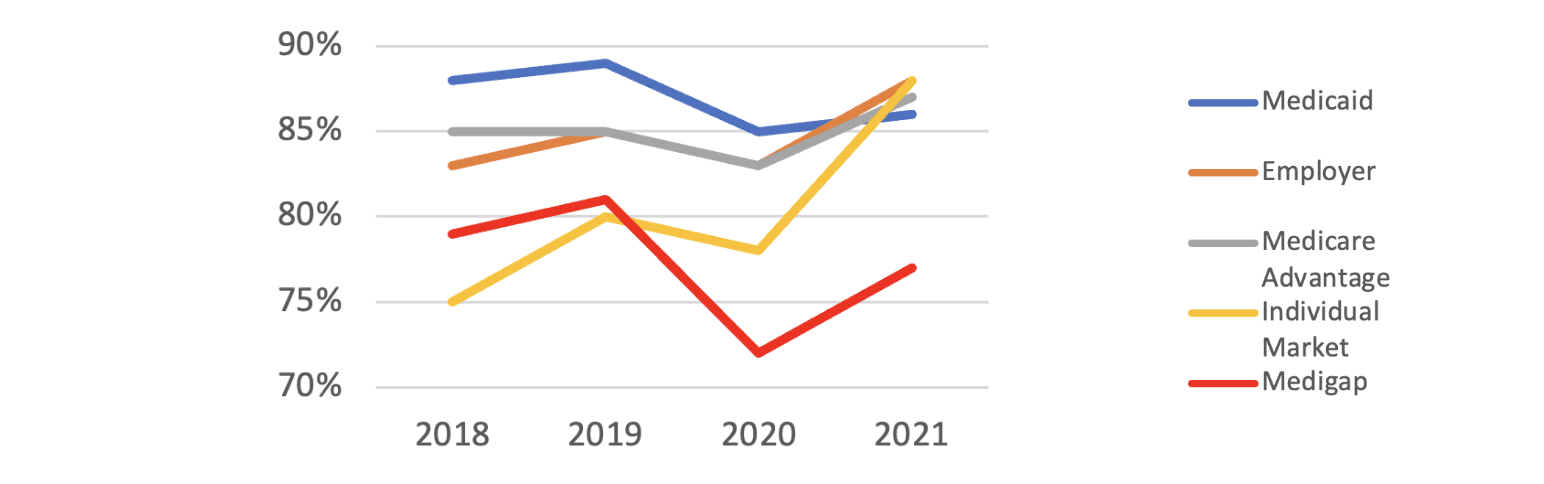
Sources: Jared Ortaliza, et al. “Health Insurer Financial Performance in 2021,” Kaiser Family Foundation, February 28, 2023 (KFF analysis of data from Mark Farrah Associates Health Coverage PortalTM), https://www.kff.org/medicare/issue-brief/health-insurer-financial-performance/; Medigap data from NAIC, “2022 Medicare Supplement Loss Ratios,” NAIC, 2023, https://content.naic.org/sites/default/files/publication-med-bb-medicare-loss-report.pdf.
Medigap markets experienced more pronounced financial improvements due to delayed and averted care in 2020 and 2021 than did other types of health insurance markets (see Figure 1). This was most likely driven by the larger impact deferred elective care had on seniors. This is ironic, as seniors who contracted COVID-19 were more likely to consult with their physicians and/or to require hospital stays (Table 1) in 2020 and 2021. However, two recent studies[1] found that on average, Medigap enrollees have significantly more income than counterparts in other markets, including Medicare Advantage (MA). Thus, it is plausible that Medigap’s relatively better financial performance can be attributable to the enrollees’ better financial security, which correlates to better health in general as well as the increased ability to avoid COVID-19 exposure during the pandemic.
Table 1
2020 Estimated COVID-19 Hospitalizations per 100,000 by Age Group
|
Age Group |
COVID-19 Hospitalizations per 100,000 |
|
0–4 |
117 |
|
5–17 |
77 |
|
18–29 |
470 |
|
30–39 |
808 |
|
40–49 |
1,219 |
|
50–64 |
2,026 |
|
65–74 |
3,395 |
|
75–84 |
5,611 |
|
85+ |
8,375 |
Source: R. Dale Hall, Achilles Natsis and Patrick Wiese. “2022 Health Care Cost Model: Documentation of Inputs and Assumptions,” Society of Actuaries, November 2021, https://www.soa.org/globalassets/assets/files/resources/research-report/2021/health-care-cost-model-doc-guide.pdf.
To a small extent, year-to-year variations of Medigap’s financial performance are influenced by Medicare Part A’s substantial hospital deductible (Table 2), which is set annually by the federal government and which Medigap is designed to cover. Another possible driver in the relatively larger pandemic-related loss ratio drop is that other health insurance products’ reported financial performances would be affected by the need to provide more timely rebates to policyholders in comparison to Medigap plans; a situation that occurs when loss ratios are too low.[2]
Table 2
Medicare Part A Deductible per Benefit Period (Most Often Applied per Hospital Stay)
|
Benefit Period |
Medicare Part A Deductible |
|
2018 |
$1,340 |
|
2019 |
$1,364 |
|
2020 |
$1,408 |
|
2021 |
$1,484 |
|
2022 |
$1,556 |
|
2023 |
$1,600 |
Source: cms.gov.
The timing of and degree to which individuals returned to using health care services after the pandemic has been difficult to analyze and predict. Is there now an overall net lower “normal” use of services caused by some proportion of the population continuing to avoid physician visits and elective hospital care? Or is a fair degree of pent-up demand emerging that might cause a temporary net uptick in utilization?
Prior to the pandemic, Medigap loss ratios were relatively stable and predictable, ranging from about 77% to 81% (Figure 2). However, loss ratios ticked down substantially in the pandemic’s first year (2020) due to fewer claims, to slightly more than 72%. Although the average loss ratio did go back to 77% for 2021, Medigap insurers may have a tougher time justifying near-term rate increases to state regulators, given the significant reduction in overall claims they experienced in 2020 and 2021. Despite demographic and coverage differences, as well as the higher relative claims experience witnessed just prior to the pandemic (2019 was historically high for the loss ratio metric), these plans are likely to be at greater relative risk for misestimation of post-pandemic claims.
Figure 2
Individual and Group Medigap Loss Ratios 2009–2021 (Loss Ratio = Claims/Premiums)
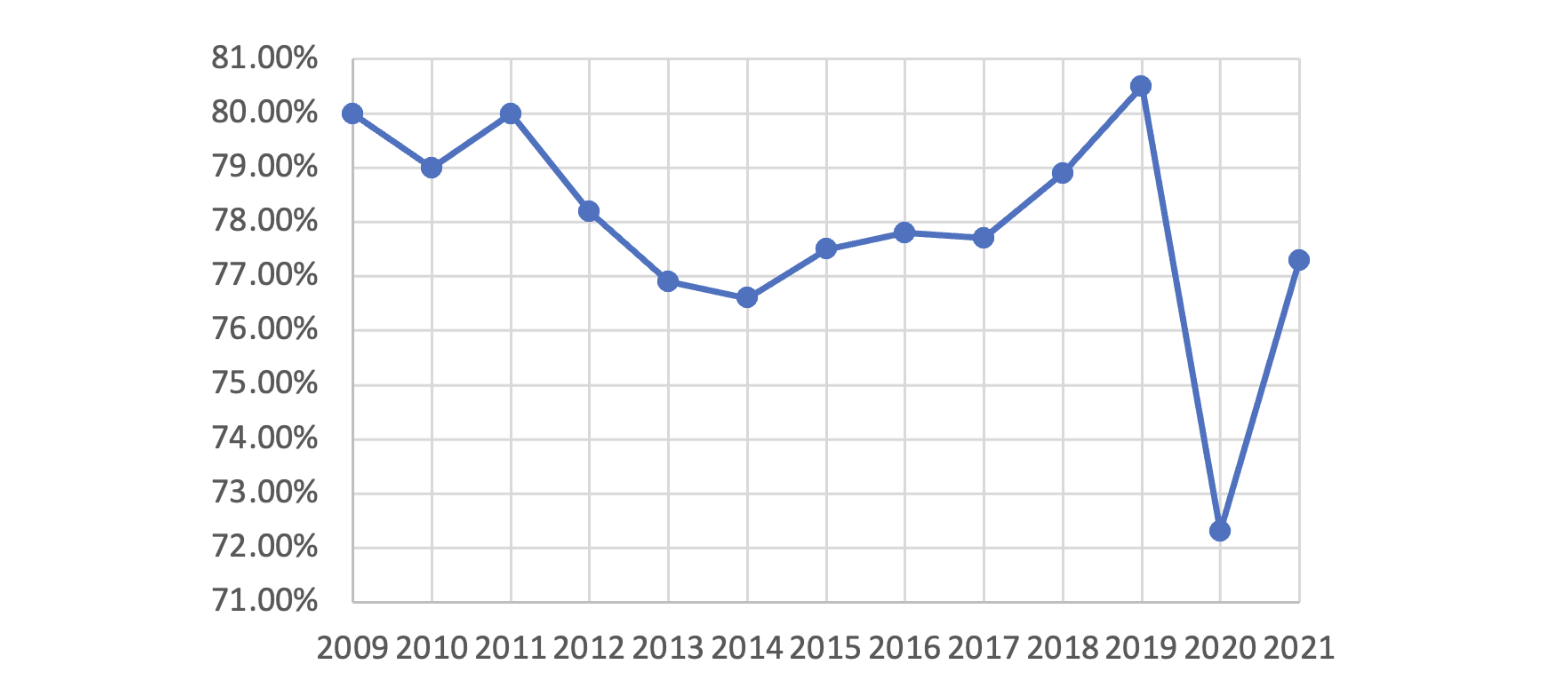
Source: National Association of Insurance Commissioners. “NAIC Medicare Supplement Loss Ratio Reports,” NAIC, 2018–2021, naic.org.
Adding to this is concern about what the future may hold in terms of potential hospitalization trends for COVID-19 and the effect long COVID might have on senior populations. Long COVID has thus far had a significant impact on individuals with circulatory and respiratory conditions, cancer, diabetes, and renal conditions—conditions that disproportionately affect those with Medicare coverage.[3]
End Stage Renal Disease’s Impact
For the past 50+ years, end-stage renal disease (ESRD) patients, no matter what their ages, have been able to enroll in traditional Medicare as long as they have met specific requirements. The 2016 21st Century Cures Act loosened the rules: starting in 2021, ERSD patients eligible for Medicare could opt instead to enroll in MA plans. Prior to 2021, ESRD patients could choose MA only if they had also been entitled to Medicare by being over age 65 or had been entitled through a permanent disability generally unrelated to ESRD.
The Centers for Medicare and Medicaid Services (CMS) has estimated that this rule change will increase the number of ESRD enrollees in MA by about 83,000 (63%) by 2026.[4] A December 2021 study by Avalere estimated that the percentage of Medicare-eligible patients with ESRD choosing MA increased from 22.7% to 30.3% between 2020 and 2021.[5]
Medigap plans, particularly plans sold in states that mandated guaranteed issue to ESRD-entitled Medicare beneficiaries (green states in Figure 3), had assumed a large degree of the 20% Part B coinsurance gap for ESRD patients for many years, particularly those patients without a retiree medical plan from their prior employer or those who do not qualify for Medicaid. Dialysis is consistently among one of the costliest treatments covered by Medigap plans, with annual coinsurance coverage often costing these plans more than $13,000 a year per ESRD patient, and costing the traditional Medicare program significantly more.
Figure 3
States Mandating Guaranteed Issue to ESRD-Entitled Medicare Beneficiaries

Source: Caroline Li, “Health Meeting Session 106: ESRD Basics,” Society of Actuaries virtual meeting, June 8, 2020.
Medigap enrollment of ESRD patients is likely to be significantly affected by the MA policy change over time, although it may still take years for Medigap insurers to see material decreases to claims as they wait for MA plans to transition to their new higher level of share of the financial burden of ESRD costs.
Gene and Cell Therapy’s Impacts
Since the emergence of gene therapy as a treatment category, several gene therapies have been successfully developed and granted approval by the Food and Drug Administration (Table 3). Even more gene therapies are in the pipeline and will likely be approved in the near future.
Table 3
Approved Gene Therapies as of February 2024
|
Gene Therapy |
Date Approved |
Condition |
List Price |
|
Luxturna |
Dec. 16, 2017 |
RPE65 retinal dystrophy |
$850K |
|
Zolgensma |
May 24, 2019 |
Spinal muscular atrophy |
$2.2M |
|
Zynteglo |
Aug. 17, 2022 |
Beta thalassemia |
$2.8M |
|
Skysona |
Sep. 16, 2022 |
Cerebral adrenoleukodystrophy |
$3.0M |
|
Hemgenix |
Nov. 22, 2022 |
Hemophilia B |
$3.5M |
|
Adstilidrin |
Dec. 16, 2022 |
Bladder cancer |
$1M+ (estimated, assuming 4 treatments) |
|
Vyjuvek |
May 19, 2023 |
Dystrophic epidermolysis bullosa |
$24,250/vial |
|
Elevidys |
Jun. 22, 2023 |
Duchenne muscular dystrophy |
$3.2M |
|
Roctavian |
Jun. 30, 2023 |
Hemophilia A |
$2.9M |
|
Lyfgenia |
Dec. 8, 2023 |
Sickle cell anemia |
$3.1M |
|
Casgevy |
Dec. 8, 2023 Jan. 16, 2024 |
Sickle cell anemia Beta thalassemia |
$2.2M |
These therapies typically cost millions of dollars per dose or course of treatment. Billing for these treatments has been under J-Codes thus far, and so they generally fall under Medicare Part B coverage.
As some gene therapies are specifically for children (e.g., Zolgensma, Skysona, Elevidys), Medicare, Medigap and MA plans are not expected to experience the full cost impacts of these therapies. That said, many gene therapies are indicated for conditions for which persons under age 65 can enroll in Medicare through meeting its disability eligibility rules. These conditions include, but are not limited to, retinal dystrophy, spinal muscular atrophy, Duchenne’s muscular dystrophy, dystrophic epidermolysis bullosa and sickle cell anemia. Thus, Medigap and MA insurers are and will be subject to some financial risk from people both over and under age 65.
Cell therapies, costing hundreds of thousands of dollars per person per year for the treatment of blood cancers, are also available. Expensive solid tumor cancer cell therapies are expected to be approved in the near future. All of these are bound to generate higher financial risks for Medigap and MA plans.
While manufacturers have yet to meet the high demand for cell therapies now available, they are working hard to find efficiencies that might make these solutions more widely available. Table 4 lists commercially available cell therapies as of February 2024. One of them, Lantidra, treats type 1 diabetes, while the rest treat certain blood cancers—including multiple myeloma, leukemia and lymphoma—and melanoma. Manufacturers are also seeking to gain FDA approval for use of cell therapies for people with earlier-stage cancers.
Table 4
Approved Cell Therapies as of February 2024
|
Kymriah |
|
Yescarta |
|
Tecartus |
|
Breyanzi |
|
Abecma |
|
Carvykti |
|
Omisirge |
|
Lantidra |
|
Amtagvi |
Manufacturer prices for cell therapies are between $300,000 and $500,000 per treatment for Medicare enrollees. However, that is not the full extent of the financial risk to Medigap and MA plans. There are also significant hospital and physician charges associated with the delivery of these treatments. Total costs of cell therapies can typically range anywhere from $600,000 to $1.2 million, with higher costs experienced at more expensive facilities or when adverse patient safety events occur. Medigap would cover Part A’s deductible and up to 20% of the Part B coinsurance charges.
There are material emerging risks for Medigap insurers for which the use of reinsurance should be considered. These include high-cost specialty drugs covered in Part B and the growing number and type of gene and cell therapies.
Impact of Baby Boomers Entering Retirement
The aging of the baby boom generation into Medicare eligibility, while a major program cost inflator for CMS and the US health system overall, is also working out to be a short-term cost deflater for Medigap and MA, at least on a per-person basis. While this may at first seem counterintuitive, over time, the influx of boomers into Medicare’s ranks may yield reduced average claim numbers in the short term, due to a younger average age of enrollees. It will, however, likely have an opposite impact as this generation ages further.
That said, there are major state-by-state differences in how Medigap rates are allocated by age. These differences play a large role in how rates work in practice in any given state and for any given insurer. For example, Medigap insurers often make individual rate increase requests for specific pooled cohorts, such as groups pooled by the year in which the policies were sold or groups pooled by plan type. When mixed with differences in state oversight on rate requests for these cohorts, there can often be a wide range in Medigap rates, even within a given state.
Diving deeper into age-rating differences in Medigap, it is important to understand that most states are “attained-age-rated,” meaning that annual rate increases are affected both by health care cost inflation and enrollees being one year older.
Four states (Arizona, Florida, Georgia and Idaho) are “issue-age-rated,” which means the age at initial issuance of the Medigap policy will drive the initial rate, and future rates will be driven mainly by common health inflation-driven rate increase requests from the insurer (but not the enrollee’s current age).
Medigap plans in eight states—Arkansas, Connecticut, Maine, Massachusetts, Minnesota, New York, Vermont and Washington—as well as MA plans nationwide are community-rated (or “no-age-rated”). This means neither the insured’s age at issuance of the policy nor their current age affect the rate. Every purchaser pays the same fundamental rate for each product, although there can often be rate differences for variables such as smoker status and geographic locations. In community-rated plans, health inflation as well as a pool’s claims experience will affect whether enrollees in these plans have an annual rate increase, and if so, the amount of the increase.
Because average medical costs increase with age, the aging of baby boomers into Medicare eligibility has been particularly advantageous for community-rated and issue-age-rated Medigap plans. The average age of the Medicare population is decreasing as more and more baby boomers turn 65 and enroll in Medicare or MA. MA rate increases have also been relatively low compared to industry expectations over the last decade, at least partly due to this phenomenon. A December 2019 study by The Commonwealth Fund estimated that the influx of baby boomers into traditional Medicare (though not MA plans, which were excluded from the study) reduced the program’s health inflation by about 0.84% per year from 2007 through 2015.[6] While policy experts and health economists often comment on this trend influence as small and immaterial, most health actuaries would disagree.
Part 1 has presented the recent trends affecting Medigap and MA products and pricing. Building on that information, part 2 will focus on how the variety of those products and pricing affects consumer choice.
Statements of fact and opinions expressed herein are those of the individual authors and are not necessarily those of the Society of Actuaries, the editors, or the respective authors’ employers.
Kristi M. Bohn, FSA, MAAA, is vice president and lead actuary healthcare excess at U.S. Group Re, RGA. Kristi can be reached at kristi.bohn@rgare.com.