
Beware the Flaw of Averages: Hidden Longevity Diversity can Materially Change Decision-making
by Douglas Anderson and Daniel A. Scholz
Risks & Rewards, December 2020

Insurers have been investing heavily in data analytics in recent years across all their business lines, with bulk annuities being no exception. Several insurers in the U.S. pension risk transfer market have started using ZIP codes to provide additional insights. These new data points are already having a twofold effect:
- Giving a more accurate understanding of plan longevity, highlighting that the old target that plan sponsors have been shooting at can sometimes be wide of the mark; and
- enabling insurers to get more confidence in refining their bid prices—ultimately reducing margins for prudence and overall prices.
But there is a third effect that may only be beginning: The impact on investment strategies for pension plans.
In this article, we consider the potential for blunt pension plan decision-metrics—which do not capture the true demographic diversity of the pension plan—to lead to poor investment decisions. We find it can apply to both plan sponsors whose strategy is to target termination through a series of annuity purchases, or those seeking to hibernate the plan, using liability-driven investing to insulate the sponsor’s profit and loss from valuation swings.
LONGEVITY DIVERSITY BETWEEN PLANS
Recent research from Club Vita revealed significantly greater demographic diversity across the spectrum of U.S. pension plans than reflected in the “standard” mortality tables used by the industry. Each of the purple dots in the scatter plot (Figure 1) represents the life expectancy of a typical 65-year-old retiree. There is a range of seven years for men or +/- 3.5 years around the mean. For women, the corresponding figures are greater (10-year range or +/- five years around mean), but their pensions tend to contribute less to the overall plan liabilities. In terms of duration, this indicates a liability may vary by almost two years simply due to the demographic profile of the pension plan. In terms of valuation, measured around the average, that changes the value of non-indexed pensions by roughly +/-7 percent (more like +/- 10 percent for indexed pensions). Similar techniques to those that Club Vita has developed for pension plans are widely used by insurers.
Figure 1
Scatter Plot of Expectation of Life of 65-year-old Men and Women in Each Plan
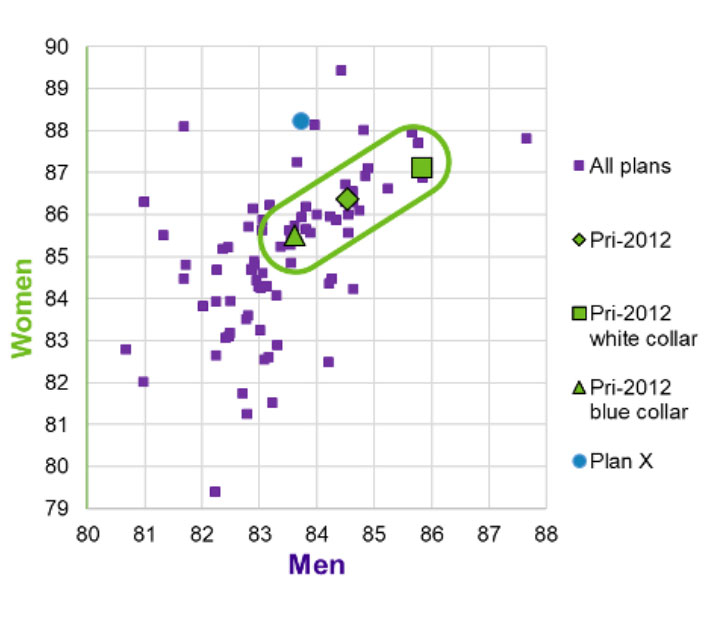
Source: Club Vita research, based on a sample of 100 private sector plans, using data between 2012 and 2016.
Figures implied by the SOA’s Pri-2012 tables are shown by green markers.
This means that a typical U.S. corporate plan with an average funding level of 87 percent[1] may have a true funding level anywhere in the range from 80 percent to 95 percent. This implies that a typical plan sponsor’s true deficit could be half or twice the size of its current indication. Such is the magnitude of sharpening the current longevity assumptions that could radically change the plan sponsor’s decision-making.
These effects are amplified further when analyzing a plan more closely because there is often hidden heterogeneity. This is important as plan sponsors are often looking to shrink their plan through a series of payments over time. A popular strategy is to buy out the smallest pensions first to reduce the fixed cost of maintaining those pensions.
LONGEVITY DIVERSITY WITHIN A PLAN
The following evaluates a cross-section of participants in one of the plans (labelled ‘Plan X’) in Figure 1, denoted by the blue marker.
Figure 2 shows what happens to liability valuation when examining a cross-section according to pension size. Note that only pensions in payment (not deferred pensions) are being considered. Pension amounts have been ranked in order of size (smallest to largest) and then split into deciles according to size of pension. The participants’ pensions were then valued on two bases: (a) a single or average valuation basis; and (b) Club Vita’s personalized valuation system, which uses both the annual pension size (as an indicator of affluence) and ZIP+4 code (as a proxy for lifestyle). The difference [(a-b)/a] in the net present value of future pension payments is plotted on the vertical axis.
Figure 2
The Misestimation of Liability Values for Pensions of Different Size
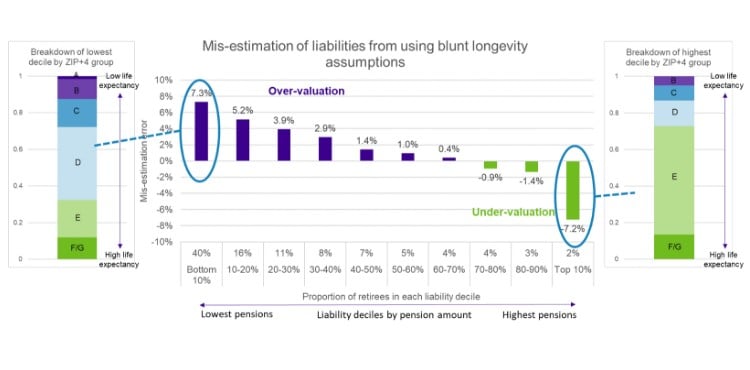
While the old and new methodologies would have produced similar results for all plan participants combined, Figure 2 shows that traditional techniques would over-value the bottom decile by 7 percent and under-value the top decile by 7 percent. This is not just because more affluent retirees tend to live longer, but also because of a micro-regional effect arising from using ZIP codes. Each of the retirees has been allocated one of seven ZIP+4 groupings (A has lowest life expectancy, G has highest). The figure shows there are more E, F and G in the top decile and more A, B and C in the bottom decile.
Plan sponsors contemplating a small pension buy out should appreciate this bias and factor into their business case the likely need to strengthen their reserving basis for the residual liabilities.
WHY IS LONGEVITY LINKED TO ZIP?
Genetic research over the last couple of decades, made possible by the sequencing of the human genome, tells us that our ancestors’ DNA explains little of the variation in life span that we observe. Current wisdom is that more than 80 percent of longevity variation across our population is attributable to lifestyle rather genetic differences. The outcome is determined by the level of preventative work—or hedonism—that goes on in middle age (healthiness of diet, level of exercise, smoking and drinking habits). A variety of techniques are now available to quantify biological age and contrast it with chronological age to reveal the pace at which an individual is aging.
COVID-19 has highlighted the profound differences that exist in the way that human beings earn their livings. Some need to travel while others do not. Some are mostly sedentary all day while others are on their feet. Similarly, some people prefer the couch to the gym during leisure time. These working and leisure habits ultimately impact longevity. Crucially, these outcomes are not randomly distributed through the population. Club Vita’s ZIP+4 clusters illustrate the differences in life expectancy in micro regions across the United States.
In other words, longevity follows lifestyle, resulting in longevity “clusters” caused by people adopting behaviors with similar degree of healthiness. Employing such granular analysis facilitates the understanding of the drivers of life expectancy for a particular subset of a plan—whether from the healthiness of resident lifestyles in the ZIP+4 areas, retiree affluence, or both.
SO, HOW DOES MORE PRECISE LIABILITY VALUATION IMPACT INVESTMENT DECISION-MAKING?
If a plan’s main objective is adequate liability funding, it follows that a more precise liability estimate will improve the likelihood of meeting that goal. This can be demonstrated by projecting out the expected future pension expenditures of a typical plan (with both retirees and deferred lives) under three different survival curves. The resulting cash flows are shown in Figure 3A.
- The central blue line assumes a “standard” mortality table is used for all participants.
- The upper green line assumes that all participants follow Club Vita’s “healthy & wealthy” cohort.
- Conversely, the lower grey line is Club Vita’s “least healthy & wealthy” demographic.
Figure 3A
Cash Flow Run-off Shapes for a Model Pension Fund (With Both Defereds and Retirees) 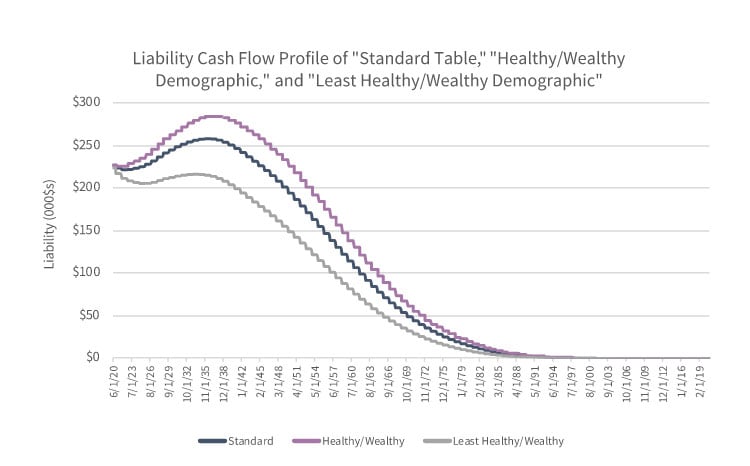
Figure 3B[2] measures the change in the shape of the cash-flow run off curve in Figure 3A, essentially quantifying the extremes of potential misestimation error. Use of the more precise demographic assumptions results in a 10 percent liability undervaluation for the most healthy demographic and a 15 percent liability overvaluation for the least healthy demographic, both relative to the standard table. Figure 3B also shows that duration and DV01, both important risk and hedge ratio metrics, may be mismeasured when using standard tables.
Figure 3B
Measures of Differences in Shapes of Cash Flow Run-off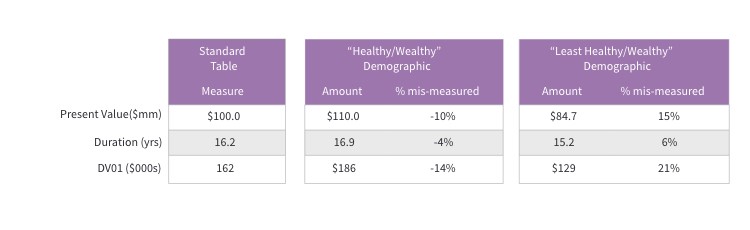
Using the “healthy/wealthy” case as an example, the pension liability may truly have $186k of DV01. If a pension manager was seeking to hedge 85 percent of the interest rate risk of the liability, but was mistakenly using the standard table measure of $162k of DV01, they would be missing their hedge target by $20k, resulting in a true hedge ratio of 74 percent rather than 85 percent (74% = 162*0.85/186).
An approximate 10 percent mismeasurement of the hedge ratio materially thwarts intended risk-management objectives. Likewise, a similar mismeasurement of liability value (and therefore funded status) may result in some undesirable surprises as the plan sponsor may need to make more contributions to the plan or find itself with a trapped surplus due to over-funding.
THE EFFECT OF MISESTIMATING LIABILITIES ON INTEREST RATE HEDGE EFFECTIVENESS
Figure 4 shows that underestimating the liability results in under-hedging the liability, while overestimating the liability results in over-hedging.
Figure 4
Interest Rate Hedge Error (as a % of DV01) Using Standard Table Measures, as a Function of Liability Valuation Error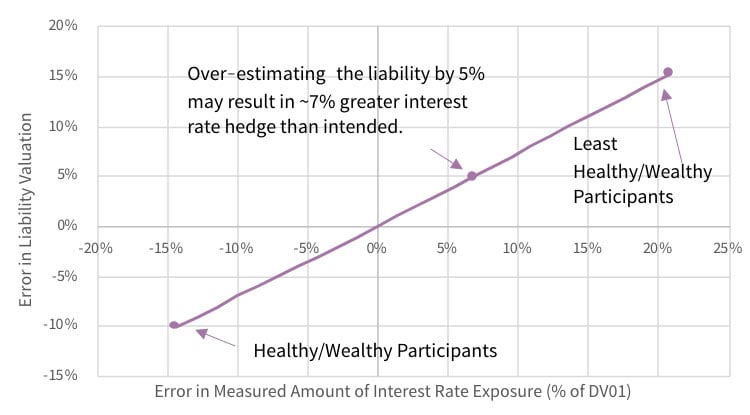
Perhaps more useful than knowing the interest rate exposure error is to know the impact on funded status volatility of the misestimation. Figure 5[3] demonstrates this.
Figure 5
Hidden Interest Rate Volatility Arising From Misestimation of Longevity of Participants
Note that even if the overall liability is somehow estimated accurately using a single longevity assumption, sub-demographic groups may be mismeasured as previously discussed. This can be critical when evaluating the economics of small balance buyouts, or the residual risk of a plan after a buyout.
Figure 6 decomposes the illustrative plan from Figure 2 into 10 deciles according to size of pension.
Figure 6
Sensitivity of Duration and DV01 to Pension Amount
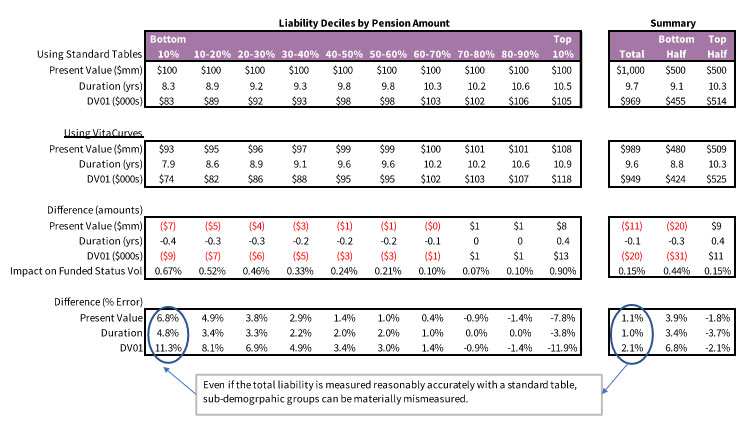
One interesting observation from this case study is that even in aggregate, the more refined assumptions suggest the liability is 1.1 percent lower in valuation than the standard tables suggest. While that may be perceived as a modest difference, it does demonstrate that the so-called “standard tables” should not be perceived as the best point estimate for a particular person’s mortality rates.
As expected, the extremes (top and bottom decile) demonstrate some material differences in valuation, interest rate exposure, and resulting impact on funded status volatility due to mismeasurement.
The results also show that the bottom half of participants have a 3.9 percent lower valuation than the standard table suggests. If a buyout were to be executed on this half, the plan sponsor would then be left with participants in the upper half. This top half has a valuation of 1.8 percent greater than that assumed by the standard table. In this sample plan, smaller pensions have shorter duration. This is caused by their being older and less affluent, both of which drive lower life expectancy. Thus, transferring out the smaller pensions while retaining the larger ones could significantly alter the duration of the assets required to minimize interest rate risk. A plan sponsor that is seeking a buyout on low-balance participants would be well-advised to investigate the discrepancies between standard tables and more refined assumptions.
BEWARE THE FLAW OF AVERAGES
All things considered, caution needs to be applied to the use of so-called “standard” mortality tables. Sharpening up these blunt estimates by using individual assumptions reveals material differences in the structure of longevity, both between plans and within plans. This brings downstream risks of misestimating liabilities and, consequently, the risk of regret in decision making by plan sponsors following all types of strategy, but particularly terminators and hibernators. Terminators that are buying out the smallest pensions in their plan may have the unpleasant surprise that they need to hold larger reserves for the residual liability. Hibernators may find that the duration of bonds and interest rate hedges required are materially different than previously indicated.
Douglas Anderson, FSA, CERA, FIA, is the founder of Club Vita. He can be contacted at douglas.anderson@clubvita.net.
Daniel A. Scholz, CFA, is director, Investment Strategies, for NISA. He can be contacted at dan.scholz@nisa.com.