
2020: What are the Takeaways for Actuaries?
By Daniel Finn
Risks & Rewards, June 2021

Author's note: After a very challenging year, actuaries need to look back and consider the lessons learned. Have we returned to where we were, or have we moved on to a new norm? What does the COVID-19 pandemic market data tell us that will help us to prepare for future global crises?
Unprecedented. Unimaginable. No big deal? 2020 was a rollercoaster for the financial markets. At the beginning of the year, the economy was enjoying the longest continuous growth stretch on record. The stock market was constantly hitting new highs. The Federal Reserve was starting to bring Treasury yields back up for the first time since the Great Recession. And, then came March …
COVID-19 cases started rising across the globe. The nightly news was littered with stories about overwhelmed hospitals and morgues. At the end of the month, there were roughly 140,000 cases, including nearly 2,400 deaths, in the United States.[1] In an effort to staunch the spread of the virus, vast swaths of the U.S. economy were shut down. These unprecedented restrictions flowed into the capital markets: The S&P 500 dropped into bear market territory for the first time in over a decade, and large parts of the bond market had simply stopped trading. Conning estimates that the resulting drop in a typical property and casualty (P&C) insurance companies’ portfolios would have been the worst in over a decade (see Table 1).
Table 1
Projected Portfolio Returns for a Typical P&C Company During 2020
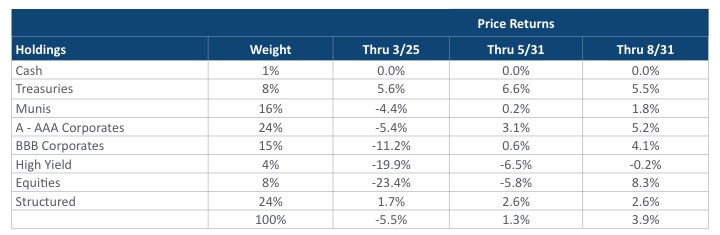
Prepared by Conning, Inc. Source: ©2020 Bloomberg, L.P.
Fast forward a few months to the end of July. The case count in the U.S. had exploded to around 4.4 million, including over 150,000 deaths.[2] The U.S. economy had just finished its worst quarter in history, declining at an annual rate of nearly 33 percent.[3] Unemployment was at levels not seen since the Great Depression. And yet, the S&P 500 was actually UP on the year! In fact, Conning estimates that a typical P&C portfolio would have been not only fully recovered from the depths of March but would have been strongly positive on the year.
Temporary Blip or Dodged Bullet?
So, what lessons should we take away from these wild swings? Naturally, as risk professionals, we are always trying to expand our understanding of what is possible in the behavior of financial markets; that way, we can help our companies prepare not only for the expected but also for the unlikely tail events that threaten solvency. However, the natural inclination might be to treat the spring months as a temporary blip, as intra-year swings will not show up on any key financial reports for many companies. Moreover, while the impact on the economy was unprecedented, the impact on large, public companies that dominate the financial markets was not as severe as the stock market drop suggested. In fact, there are some segments of the technology sector, such as online shopping and delivery services, that used the quarantines to expand their services to a whole new client base.
While there is an attractiveness to those arguments, we are taking a different approach at Conning. First, we recognize that these events could very easily have started three months earlier. That would have put the peak of the crisis in the United States in December, which would have directly impacted the annual reports that drive most insurance companies’ regulatory and rating agency oversight.
Second, it is very important to remember the extraordinary responses from the U.S. government that helped create this rapid turnaround: the Federal Reserve created an alphabet soup of new programs to help support everything from loans to small and mid-sized companies to Asset-Backed Securities, all of which pumped trillions of dollars into the economy. In a rare sign of bipartisanship, the U.S. government also passed multiple rounds of economic stimulus within a few weeks, culminating in the passage of the two-trillion-dollar CARES Act. While these may seem to have been inevitable in hindsight, the U.S. government has not always acted so decisively; for example, it is worth noting that they greatly outweigh the actions undertaken to stem the 2008 Financial Crisis in both scale and scope.[4] It is also not at all a given that Congress would be able to pull this type of massive rescue package together for any given crisis, especially in an election year.
Finally, as we mentioned in our April white paper, “Stress Testing in the Pandemic Age,” while the underlying cause may not have been anything we have seen in the United States for over one hundred years, the financial impacts were definitely within the range of market movements we have experienced in the more recent past.
Refining Our Models
Given that framework, the first question we want to answer is: “How prepared were we for these types of market swings?” In the insurance industry, companies rely on economic scenario generators (ESGs) to produce a wide range of plausible, cohesive futures for the variables that drive their results—for example, corporate bond and equity returns, as well as Treasury yields. These models are not predicting specific events, like a pandemic or a war; instead, they simply attempt to estimate the likelihood of a 20 percent drop in the equity market over the next year. So, to answer the question posed above, we need to test how well the ESGs that we use were able to predict the financial market movements we saw in 2020. If our models covered these types of results, then we can take comfort that we were well prepared; if not, then we have to think about how to adjust our framework to be better prepared for the next calamity. At Conning, we find it useful to go back to the state of our model as of a particular start date from before an economic event[5] and compare the generated distribution of that time to what occurred in the markets. We want to use the version of the model from that time rather than the most current version to avoid the updates and refinements that would have been made as a result of the events we are testing. For example, if we took today’s model and recalibrated it back to 2007 levels, we would expect to see the movements that happened in credit spreads, since the ESGs of today have been calibrated to that scenario. A more interesting question, especially for actuaries, is “How well did the model help me anticipate those types of changes before they occurred?”
“It is useful to go back to the state of a model as of a particular start date from before an economic event and compare the generated distribution of that time to what actually occurred in the markets.”
Furthermore, to help illustrate some of the potential differences between models, we will perform these tests with both Conning’s own GEMS® Economic Scenario Generator and the ESG used by the American Academy for regulatory purposes by U.S. Life insurers. Finally, we will test the drops we saw in the first quarter as well as the recoveries we saw in the second. Some might ask, why test both of these? Don’t we only care about the downside events? While risk management has historically focused on downside risk, there has been an increasing realization in the actuarial community that we need to focus on both risk and reward; specifically, an actuary’s role today is not just focused on minimizing their company’s risk, but to ensure that the organization prudently uses risk by focusing on those areas of the business where they get appropriately paid to shoulder their clients’ risk burden.
To begin this analysis, we will focus on the market that gets the most attention: the S&P 500.[6] In Figure 1a, we compare the distribution of total returns across 1Q 2020 from these two economic scenario generators to the actual -19.6 percent that the S&P 500 lost over that period. Since this was one of the fastest market corrections on record, it is not surprising that the actual result is an extreme tail event for both models. However, it is concerning how large the gap is for the AAA model, as the historical data is over 7 percent below the model’s first percentile projection. In fact, there are only two scenarios out of the 10,000 where the AAA model’s returns are worse than the actual historical event. By comparison, the 1.5 percent gap and 0.67 percent probability associated with the GEMS ESG’s results seem much more reasonable, especially since we have seen similar quarterly losses before (e.g., the S&P 500 lost -22.5 percent in the 4Q 1987, largely driven by the huge drop on Black Monday).
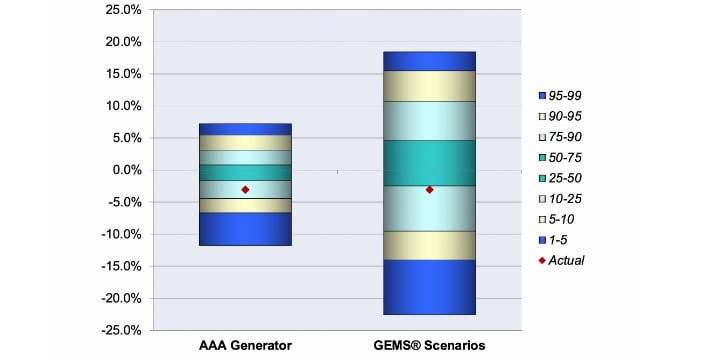
The picture for the second quarter (see Figure 1b) is somewhat similar: the AAA model’s 99th percentile is about 8.5 percent lower than the 20.5 percent seen in 2Q 2020, while the GEMS ESG’s miss is about half of that. The fact that we have seen several three-month periods with this type of jump—most recently from March through May of 2009 right after the S&P 500 bottomed out—suggests that both models may need to adjust their volatility, especially for shorter-term projections. These concerns would be missed if we only focused on the first-half projections (see Figure 1c); those results were slightly below expectations for both models, but still well within their range.
Figure 1a
Comparison of AAA and Conning’s 1Q 2020 S&P 500 Returns
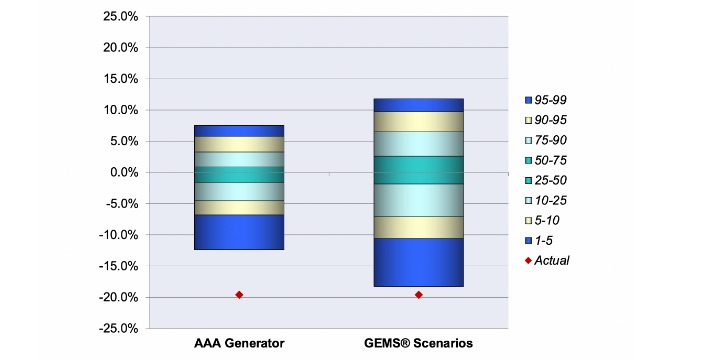
Figure 1b
Comparison of AAA and Conning’s 2Q 2020 S&P 500 Returns
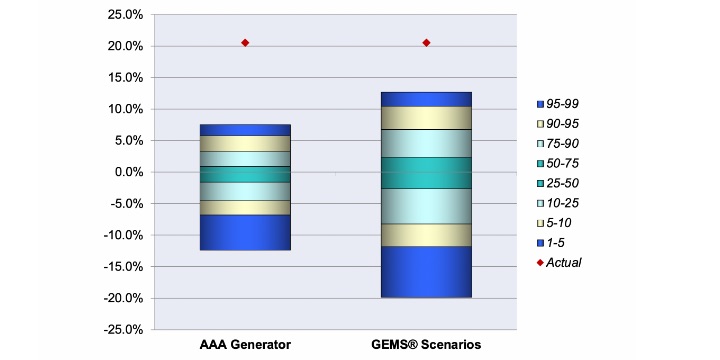
Figure 1c
Comparison of AAA and Conning’s 1Q and 2Q 2020 S&P 500 Returns
Prepared by Conning, Inc. Source: GEMS Economic Scenario Generator scenarios.
Based on these results, users of the Conning ESG should take a great deal of comfort that their analysis properly incorporated the equity market losses we saw in 1Q 2020; as we can see, the returns were unlikely, but not impossible. The miss on the 2Q 2020 results is slightly disconcerting, given the magnitude of the divergence, but the downside does tend to be more important for risk analysis. The results of the AAA ESG, on the other hand, were more concerning; that model missed badly on both the 1Q downside and the 2Q upside, with the historical data being nearly outside the realm of possibility. As a result, companies using that model would likely have understated the potential risk for their equity portfolio, which may have led them to over-allocate to the equity market. Clearly, this type of result should lead to a recalibration of that model given these new data points.
Be Wary of Comforting Conclusions
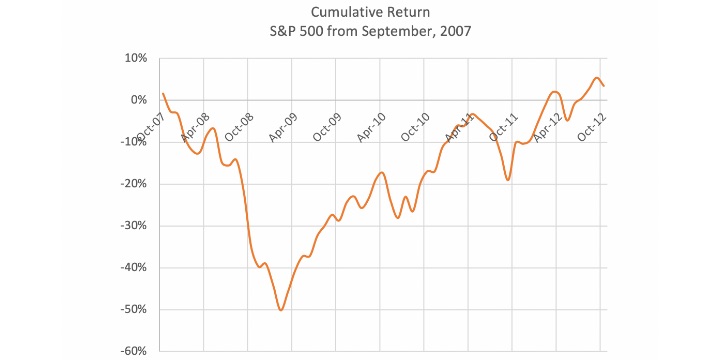
One concerning conclusion that many market participants seem to be drawing from last year’s wild ride is that equities will always bounce back. Specifically, the theory goes that whenever the market crashes, the Federal Reserve and U.S. Government will step in to prop the market back up. They can even point to historical data: the market did bounce back from both Black Monday (Figure 2a) and the 2008 Financial Crisis (Figure 2b). The problem with this theory, however, is that we only know when the market hits bottom in hindsight. With Black Monday, everyone remembers the big one-day crash in October of 1987, but they probably forget that the market dropped over 8 percent in November of that year, too. During the 2008 Financial Crisis, the market took nearly a year to drop as much as we saw in the first quarter of 2020, but that wasn’t the end to it: the market actually lost an additional 40 percent from that point before it finally bottomed out in February 2009.
“While the general upward march of the market makes it nearly certain that equities will eventually recover, ‘eventually’ can be a very long time.”
In addition, while the general upward march of the market makes it nearly certain that equities will eventually recover, “eventually” can be a very long time: The market took almost 15 years to recover from the Great Depression! As actuaries, we need to understand and plan for this possibility, especially given the long-term nature of many of our company’s liabilities.
Figure 2a
Path of S&P 500 Recovery After Black Monday (October 1987) Crash
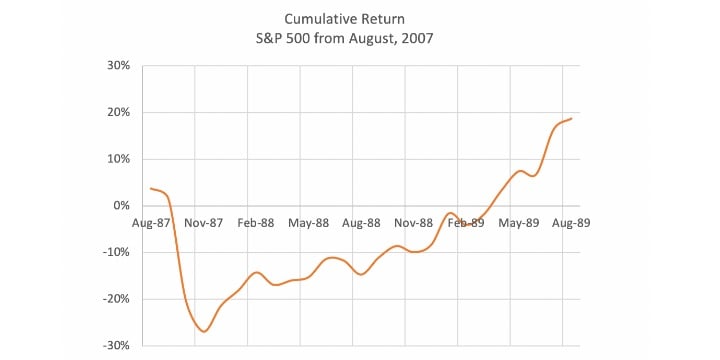
Figure 2b
Path of S&P 500 Recovery After 2008 Financial Crisis (October 2007) Crash
Prepared by Conning, Inc. Source: ©2020 Bloomberg, L.P.
The Other Side of the Balance Sheet
Interestingly, perhaps the most important lesson from 2020 was not on the asset side of the balance sheet at all. All insurance sectors saw major impacts from both the virus and the resulting economic dislocation. The most obvious impact was on the life insurance market: The sheer number of fatalities, especially among the elderly, is likely to lead to a marked increase in losses on life products. In the health market, the large number of hospitalizations and the questions about whether the insured or the company is going to pay for them created a lot of uncertainty for these insurers. However, overall, the dramatic decrease in utilization, first due to government restrictions and then the reluctance of many patients to go to the hospital, may lead to increased profitability for these companies (see Table 2).
Finally, for property and casualty insurers, the biggest impact was on the premium side: For commercial lines, just about every exposure basis was down substantially. For example, payrolls, which drive workers comp premiums, were down due to the jump in unemployment. Even more surprisingly, many personal auto insurers voluntarily offered their clients rebates due to the unprecedented drop in driving caused by the lockdowns (see Figure 3).
On top of all of these changes, there remains lots of uncertainty about what these markets will look like going forward: How will insurers adjust their sales practices due to reduced face-to-face contact? How will the reduced economic activity affect sales levels? Will the increased focus on risks lead to increased market penetration over the long term? All of these unanswered questions reinforce a key risk management lesson: When extreme things happen, we usually see impacts that we never anticipated under normal circumstances. Because of that, we need to ensure that we treat our work with a fair bit of humility: Our best models will be useful, but they can never fully anticipate what will happen in the tails of the distribution.
Conclusions
So, where does this leave us? First, we should take a critical look at how well our key economic models performed at anticipating these types of extreme market movements. If our models were not up to the task, then we need to rethink how those models are calibrated, as this is likely to lead us to either take on too much risk or the wrong types of risks. We also want to make sure we perform this review on both the good times and the bad times since we are using these models for much more than just risk measurement.
Second, we need to avoid dismissing risk just because things turned out fine. Certainly, we would all prefer that the equity and credit markets recovered quickly, but if we use this as an excuse to avoid the real problems that these investments faced in March, we are likely to put our companies’ portfolios in harm’s way the next time a market correction comes along.
Finally, we all need to learn a bit of humility from things our models did not anticipate about 2020’s events. While risk models are a very useful tool to help senior management make good risk/reward tradeoffs, they are all just approximations of the real world, and our models will never be robust enough to anticipate all possible outcomes. This is especially true in extreme scenarios, since, by definition, they do not occur often enough for us to be able to catalogue all possible side effects.
If we are able to do all of these things, then all the tumult from COVID-19 will have helped us to make our companies better prepared for the next catastrophe, whatever that may be.
Table 2
Medical Loss Ratio
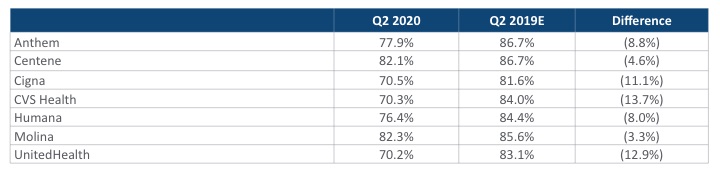
Prepared by Conning, Inc. Source: Company Q2 2020 Earnings Press Releases
Figure 3
Personal Auto Insurance Refunds
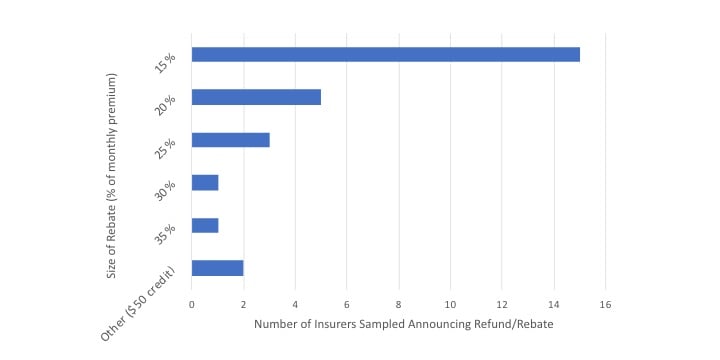
Prepared by Conning, Inc. Source: company press releases.
Statements of fact and opinions expressed herein are those of the individual authors and are not necessarily those of the Society of Actuaries, the editors, or the respective authors’ employers.
Daniel Finn, FCAS, is a managing director at Conning. He can be contacted at daniel.finn@conning.com.