
Pension Risk Transfer: Staying Current in a Rapidly Evolving Market
By Roberta Harris, Tanner McKerlie, Fiona Ng, Ashleigh Sandrock and Lin Sun
Risks & Rewards, December 2023

Editor’s note: This article first appeared on milliman.com. It is reprinted here with permission.
The year 2022 broke records for pension risk transfer (PRT) market activity, with single-premium transaction levels of $51.9 billion—compared to $38.1 billion in 2021. The record-breaking momentum is continuing as we witness close to 30% increase in single-premium transactions in the first half of 2023 over 2022, bringing in over $22.5 billion. While plan sponsors have been seeking solutions for their pension obligations for decades, a significant majority of them were hindered by the wide differential in the amount of assets that sponsors held to support their accounting obligations and the amount that insurance counterparties asked for to transfer the liability. Starting in 2022, transfer pricing became more competitive due to the convergence of higher funded status for most defined benefit (DB) pension plans and the increasing number of insurers providing solutions to plan sponsors.
While the activity has been rewarding to many insurers participating in the market, the increase in competition and in market volatility elevates the need to regularly evaluate strategic asset allocation (SAA) considerations to transact in the market successfully and sustainably.
This paper focuses on the key SAA considerations for PRT transactions and the importance of reexamining SAA decisions particularly when market conditions are volatile. Because a major trend in the insurance industry has been the increased investment in alternative assets, this paper also provides an illustrative case study that evaluates the impact of alternatives on investment returns under the U.S. statutory framework and highlights how the risk-return trade-off is affected as markets change. We conclude with a discussion of considerations that have been simplified for purpose of the case study.
Background
There has been a notable shift in corporate retirement plans from defined benefit plans to defined contribution (DC) plans over the past 30 years. At the same time, existing DB pension plans continue to accumulate benefits, leaving many plan sponsors with large future obligations. For many plan sponsors, the core business is far removed from the long-term investment and operational expertise needed to effectively manage defined benefit pension obligations for their employees. Additionally, the pension accounting rules can contribute to earnings volatility in their financials.
The current protracted market volatility and relatively high interest rates have encouraged plan sponsors to explore strategies that can reduce the financial risk associated with their plans. Such strategies, commonly referred to as PRT, were historically associated with plan terminations, but strategies that remove only a portion of a sponsor’s plan liability have become increasingly common.
Recently, plan sponsors have seen significant discount rate increases that decreased their accounting liabilities and improved funded statuses. The Federal Reserve increased interest rates by 425 basis points (bps) in 2022 and another 50 bps in February and March 2023—the highest level of interest rates since the 2007-2008 global financial crisis. The funded status for the 100 largest private pensions increased on average by 12% from fiscal year 2020 to fiscal year 2023.[1] The increase in funded status improves the economics of PRT as plan sponsors have an opportunity to de-risk plans through annuity purchases from insurance counterparties by transferring assets close to the accounting liability.
The increased number of successful transactions has accelerated the development of the market both in terms of demand from the plan sponsors and supply from the insurance industry. The market has attracted the interest of additional insurers, particularly those who can leverage their capital efficiencies and asset capabilities to offer competitive bids.
Competitive Bids
The fiduciary duty of plan sponsors to act in the interest of plan participants applies to selecting an insurer in a PRT transaction, which includes verifying the financial stability of different insurers. With many insurers touting high ratings, however, differentiation between competitive bids often comes down to finer details of an insurer’s bids and capabilities. This creates a significant incentive for market participants to continue searching for ways to enhance bids while balancing the need to maintain successful PRT block performance.
As a result of these dynamics, two notable trends in PRT bids have developed over the last few years.
- The cost of transactions for plan sponsors, relative to accounting liability, has generally decreased over time, particularly in the past five years.
- The most competitive bids in a transaction are typically 1% to 3% lower than the average bid, but the spread has widened in the past two years.
Figure 1
Milliman Pension Buyout Index as of July 31, 2023
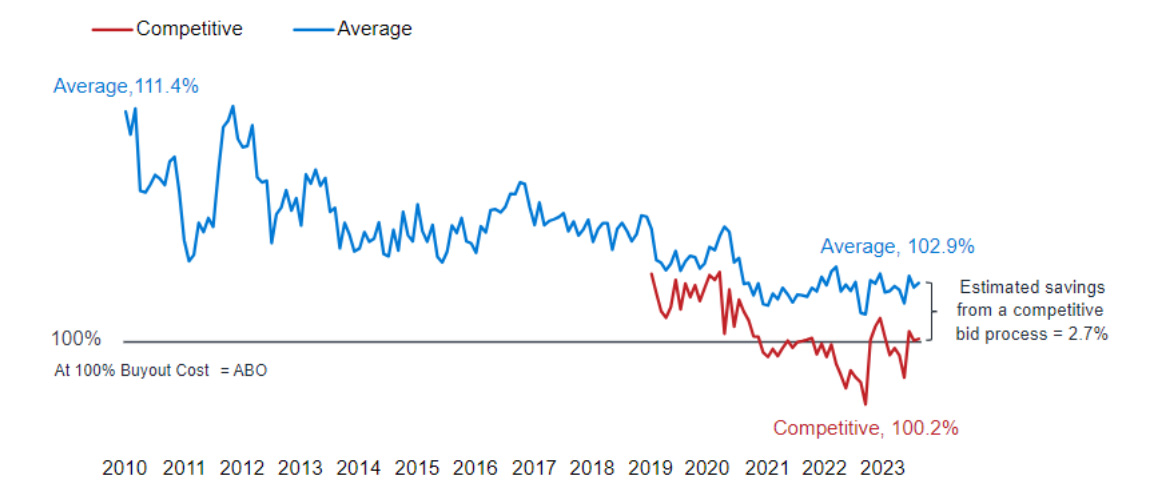
Milliman Pension Buyout Index May 2023 (https://www.milliman.com/en/insight/milliman-pension-buyout-index-august-2023)
This suggests that the increased competition from additional insurance participants has resulted in more attractive pricing for plan sponsors. For insurers actively pursuing PRT transactions, continued reexamination of their pricing processes and assumptions is a key part of achieving their planned target production and profitability.
Key SAA Considerations
The relative stability of the PRT liability magnifies the importance of SAA on successfully participating in the market.
- Assets are commonly transferred to the insurer in a single lump sum payment and the insurer generally has the autonomy to invest in assets according to the insurer’s own methodology and risk framework. Assets are also rapidly invested once the premium is transferred so target returns can be achieved. Accurately determining the appropriate asset allocation and the associated return expectation can be challenging, particularly in times of capital market volatility.
- PRT blocks generally have immaterial lapse risk relative to other fixed annuity products. Pensioners do not lapse policies and receive fixed, level payments. Generally, the main sources of uncertainty in liability cash flows stem from longevity risk and utilization risk for deferred lives, resulting in a comparatively stable liability profile for pensioners already utilizing their benefits.
- Coupled with relatively stable payment streams, PRT blocks generally have longer durations compared to other fixed annuities, presenting a particularly strong case for focusing on the impact of SAA, as it is a key driver of profitability.
Broadly, the goal of SAA is to achieve the best risk-adjusted returns possible, consistent with the company’s risk appetite and tolerance. In the United States, assessing the efficiency of a given investment strategy through the lens of the present value of distributable earnings (PVDE) is often considered best practice for SAA analysis. This approach has the following advantages:
- It incorporates explicit reflection of the cost of regulatory-required capital and the required return on the bidder’s investment.
- It represents a holistic view of earnings and risk, rather than asset-only metrics. For instance, an ability to recognize cases where asset and liability risks are offsetting, capturing market shock impacts to the total balance sheet, etc.
- It provides a metric consistent with an embedded value view of the business.
- It enables the measurement risk in terms of loss of dividend-paying capacity.
Commonly, return is measured on a best-estimate PVDE basis, whereas risk is measured as a potential loss in PVDE, either through stylized market scenarios or through value at risk (VaR) or conditional tail expectation (CTE) calculations.
Case Study
After the global financial crisis, many life insurers were focused on how to increase returns under a prolonged low interest rate environment. Over the recent low interest rate period, many insurers increased their overall risk tolerance and increased their allocations to alternative asset classes, to target higher yields. Our case study revisits the question of asset allocation in the current high interest rate environment and illustrates the importance of evaluating the asset composition as markets continue to shift. In the past, the differential in yield expectations between fixed income assets and alternative assets provided significant overall portfolio yield uplift even after factoring in the additional risk capital requirement associated with alternatives. However, the opportunity cost of investing in fixed income assets relative to alternatives can be much lower with the increase in interest rates.
In our case study, we illustrate that, as the expected yield differentiation between fixed income assets and alternatives narrows, the risk-adjusted returns for these two asset classes can converge. The case study is based on a block of $2.0 billion of pension risk transfer group annuities composed of in-pay policies with a modified duration of 7.3. The baseline asset portfolio is composed of 88% above investment-grade fixed income assets and 12% of below investment-grade fixed income assets. The initial net asset yield for the fixed income-only SAA is 5.35%.
We considered the following factors in the analysis to incorporate alternatives into the SAA mix:
- The assumed allocation to alternatives.
As there is a wide range of asset portfolio allocations to alternatives across the industry, for this analysis we look at alternative allocations of 5%, 7%, 10%, and 12% to illustrate a range of potential strategies.
- The long-term return assumption of alternative assets.
Typical long-term industry levels range from 8% to 14%, with some commanding higher returns based on specialized asset manager views. Insurers typically consider the alternative asset buckets to include private equities, real estate equities, and other nontraditional alternative fixed income such as structured alternatives. For this analysis, we study the impact of assuming 8%, 10%, and 12% net returns.
- The economic stress on the value of the alternatives.
For companies managing through the current volatile environment, sensitivities on equity investments, interest rates, and credit spreads (net of investment expenses and defaults) can be used to assess PVDE, incorporating a company’s investment guidelines and future market views. Stresses on the key factors can be based on historical tail events and the likelihood of events can be weighed against the change in the PVDE. For this analysis, we look at the impact of a 20% decrease in the asset value of alternatives under stress.
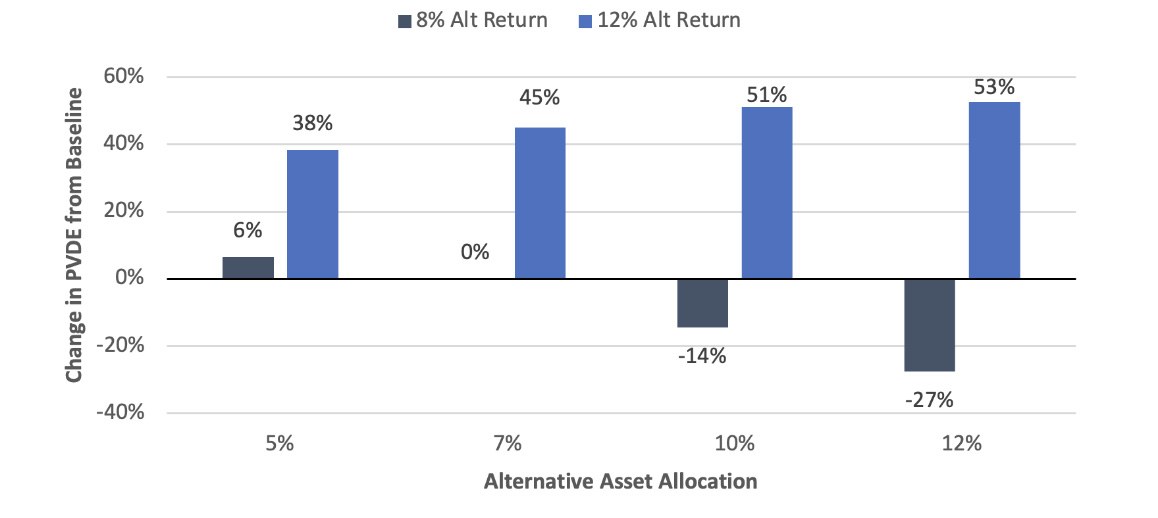
The case study illustrates two key takeaways:
- The higher the assumed alternative return is relative to the those generated by other asset classes, the more worthwhile it is to rebalance into alternatives from a present value of distributable earnings (PVDE) perspective.
Along with excess return, private equity brings a higher C1cs capital charge of 23.7%. This increased capital requirement does significantly dampen the positive pickup to profits when the assumed return on the alternatives is close to the PVDE discount rate. Given the diversification allowed within the required capital formula, the additional capital charge can be offset to various degrees by the covariance benefit. When the expected alternative return is significantly higher (along a baseline scenario without shocks), PVDE continues to increase, with higher allocations to alternatives despite the headwind from increased capital requirements.
Figure 2
Higher Expected Alternatives Returns Counter Increased Capital Requirements Under Baseline Scenarios
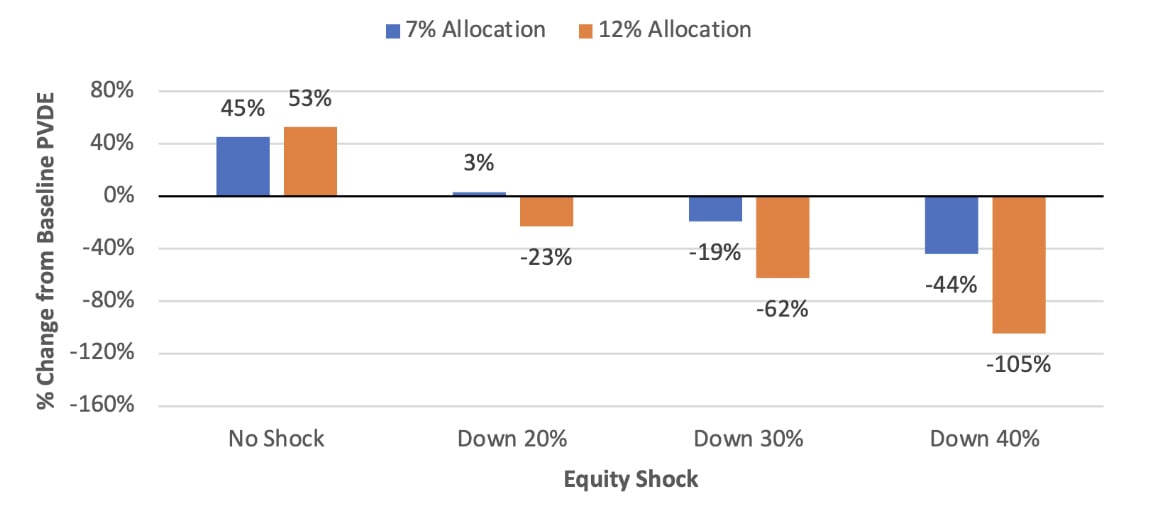
- The choice of alternative asset allocations should encompass analyzing earnings under a distribution of stress scenarios.
As the allocation to alternatives increases, the sensitivity of the PVDE to equity shocks also increases. Understanding the breakdown point when a stress to the alternative assets eliminates the higher level of risk-adjusted returns is a key benchmark to measure against historical and expected performance.
The stress scenarios should also consider the timing of the shock as the impact on the present value of distributable earnings can vary significantly depending on the period in which it occurs. A shock happening in the beginning of the projection would have a greater impact on present value than a shock in the distant future, because of the effect of discounting.
Figure 3
Increased Alternatives Allocation Increases Equity Shock Risk Exposure
The above hypothetical case study has been distilled to illustrate potential impacts of investing in alternatives to support a liability product with predictable cash flows. In practice, there are other key drivers that would impact the analysis and conclusions.
Uncertainty in Participant Behavior for Deferred Lives
The PRT market is segmented between plans with in-pay only lives and those with a mix of deferred and in-pay policyholders. Although in-pay benefits are highly predictable, most major PRT writers choose to participate in the deferred lives market, as the additional utilization risk can be rewarded with additional returns.
Participants with deferred benefits have numerous choices, the two most notable being when to retire and which payment form to elect upon commencement. Plan-specific credible data for developing assumptions to model this behavior is rarely available. While general trends can be used to develop assumptions from industry data, the effects of an individual plan’s unique provisions (such as reduction factors for early retirement) can significantly alter participant behavior relative to broader industry experience.
This uncertainty represents a challenge to insurers. Pricing with aggressive assumptions increases the risk of experience losses on the block but using conservative assumptions (such as assuming participants will efficiently maximize their benefit options) will likely lead to less competitive bids.
Risk Capital Drivers
The analysis we have shown was based on the U.S. risk-based capital (RBC) framework where the risk capital for asset credit risk follows a factor-based approach that vary by credit rating and asset classes.
The type of alternative assets could have a material impact to the level of capital the company is required to hold. Alternative assets reported under Schedule BA with equity characteristics typically have the same treatment as common stock under the RBC framework. These assets have the highest standalone after-tax capital requirement of 23.7%, though this can be partially offset by diversification benefits. Real estate equities have a lower factor than pure equities, which may make them a more appealing asset class. Some rated alternative assets may qualify for fixed income treatment and hence receive significantly lower standalone risk capital requirements. Investment-grade-rated fixed income assets have after-tax risk charges that range from 0.13% to 1.80%.
The RBC framework recognizes a diversification (covariance) benefit across risk factors for both liability and asset risks. As the longevity risk charge on the PRT business can be diversified with the mortality risk on life insurance policies, there can be substantial benefit to writing longevity risk for companies with substantial mortality risk. Adding alternatives can also increase the capital diversification by having a mix of equity-like alternatives and fixed income assets. Companies that employ sophisticated SAA analysis typically will have the opportunity to analyze and optimize SAA, based on the blend of business and specific asset types within a company’s business plans.
Jurisdiction Considerations
Regulatory regimes have different reserving and capital requirements, and their views and treatments of longevity risk and asset risk can be significantly different. While our case study is constructed under U.S. statutory reserving and the National Association of Insurance Commissioners (NAIC) RBC framework, the analysis of optimizing PVDE should be tailored to the regulatory and tax considerations in the jurisdiction where the business will reside. These considerations will fundamentally affect the basis and profitability metrics of the PRT bid.
Alternative Assets Modeling
For the case study, a simplified approach to modeling alternative assets is taken both for projected cash flow and capital treatment. In reality, the types of assets that fall into the alternative asset bucket are complex and require careful and thoughtful modeling to capture timing of the expected cash flows and the relationship between the expected return and risk profile. Being able to model the market value and cash flows of these complex assets under various interest rates and market stresses will enable management to make decisions based on comprehensive analysis. In addition, the capital treatment for alternative assets varies significantly depending on the structure of the assets and the regulatory jurisdiction. The ability to weigh the trade-offs of investing in different alternatives and to different degrees is key to understanding the impact on future earnings.
Management Decision Drivers
Most companies have an internal view of target capital levels optimal to support the business, and this view, along with other factors, in turn informs shareholder dividend distribution decisions. Holding excess capital helps a company be better equipped to weather unexpected market volatilities. However, there is also an opportunity cost associated with holding excess capital. Management decision drivers, such as potential needs to hold a capital buffer, can therefore have an impact on PVDE value.
Risk composition inherent within an insurer’s profile could have significant effects on the asset strategies chosen, beyond purely regulatory perspectives. Companies often have their own internal views of required capital. Holistic stress testing that encompasses enterprise risk factors and the company’s view on probable market scenarios is important as part of the evaluation as well. In addition, insurance companies also desire to maintain strong credit ratings from independent rating agencies such as A.M. Best, Fitch, Moody’s, and Standard & Poor’s. Strong credit ratings signal to the public an insurer’s financial strength and its ability to pay out promised benefits. While different agencies have their own rating scales and methods, ratings are based on an insurance company’s liquidity, profitability, investments, and liabilities. Being well capitalized, employing effective asset strategies, and having a strong risk management framework in place help exude confidence to rating agencies that the company can weather various adverse market conditions.
Conclusion
As the insurance industry adjusts to the current market environment, it is critical to reassess the heuristics that were developed in the decades when interest rates seemed to be on an everlasting journey downward. Among them was a view that increasing allocations to alternatives was a straightforward approach to achieving necessary target yields. As the case study illustrated, while PRT’s relative insensitivity to interest rate movements translates to predictable and stable cash flows, the picture has become currently more complex with the narrowing yield differentiation between fixed income assets and alternatives. The level of investment in alternatives to meet return objectives should be assessed with regulatory and rating agency perspectives as well as the insurer’s internal views of risk.
As PRT transactions often unfold over a period of a few months, it is critical that insurers are able to rapidly adapt pricing assumptions and returns to changes in market conditions. Periods of increased market volatility can render initial bids outdated; insurers that are able to quickly adapt strategies and assumptions using robust SAA analysis can remain competitive in bidding and appropriately assess the risk-return profile of various asset portfolios and their impacts on transaction profitability.
Appendix A
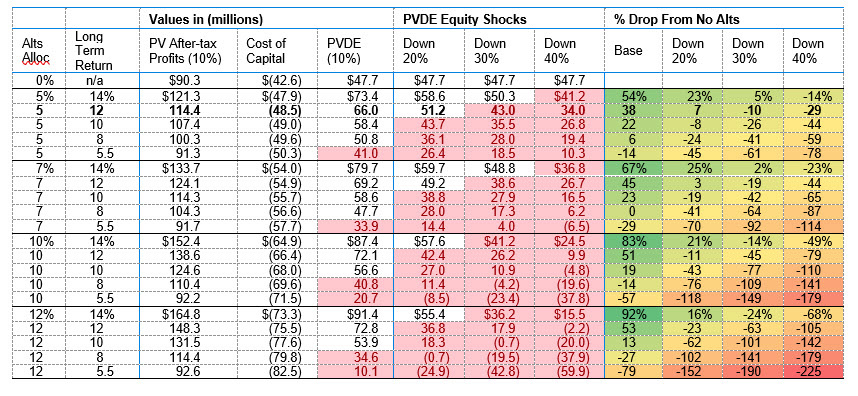
Our case study focused on several combinations of alternative allocation and long-term return assumptions as shown in the table in Figure 4. The modeled asset portfolio has a book value of $3.1 billion and a Macaulay duration of 7.8 years. Fixed income returns are based on market conditions as of Aug. 19, 2022.
Figure 4
Case Study Assumptions
Statements of fact and opinions expressed herein are those of the individual authors and are not necessarily those of the Society of Actuaries, the newsletter editors, or the respective authors’ employers.
Roberta Harris, FSA, MAAA, is a consulting actuary for Milliman, Inc. Roberta can be contacted at Roberta.harris@milliman.com.
Tanner McKerlie, FSA, MAAA, CERA, is a consulting actuary for Milliman, Inc. Tanner can be contacted at Tanner.mckerlie@milliman.com.
Fiona Ng, FSA, CFA, CERA, MAAA, is a principal and consulting actuary for Milliman, Inc. Fiona can be contacted at Fiona.ng@milliman.com.
Ashleigh Sandrock, ASA, is an associate actuary for Milliman, Inc. Ashleigh can be contacted at Ashleigh.sandrock@milliman.com.
Lin Sun, FSA, MAAA, is a principal and consulting actuary for Milliman, Inc. Lin can be contacted at Lin.sun@milliman.com.
Endnote
[1] Milliman 100 Pension Funding Index https://www.milliman.com/en/insight/2023-corporate-pension-funding-study