
Enhanced Liability-Driven Investing (LDI): Looking Beyond Annuities and Public Bonds to De-risk the Plan
By Maxime Carrier, Martin Dionne and Claude Lockhead
Risks & Rewards, April 2024

With defined benefit (DB) pension plan financials ended the third quarter of 2023 on a solid footing and improving the capacity to take meaningful de-risking actions, this article takes a look at how DB plans can de-risk at reasonable costs. Those plans may find it beneficial to consider a broad range of investment options, for example completing a core bond allocation with private credit and income-oriented alternative strategies can help achieve important savings over other frequently pursued de-risking approaches, without materially increasing the funded status volatility or downside risk.
The Stronger the Wind, the Stronger the Trees
Despite the recent market turmoil, Canadian DB pension plan financials are on a solid footing, even following the financial and economic storm induced by the COVID-19 pandemic. While volatility is still abundant, the solvency ratio of Canadian plans has improved over the past four years according to data tracked by several consulting firms as well as those reported by regulatory bodies. For instance, according to the Financial Services Regulatory Authority of Ontario (FSRAO), the median Ontario DB pension plan had a solvency ratio of approximately 85% in Q1 2020. As of Sept. 30, 2023, the pendulum had swung in the other direction with a median plan funded ratio of 117% and 85% of plans boasting a funded ratio greater than 100% (see Figure 1 below).
Figure 1
Evolution of the Ontario DB Pension Plans Funded Status 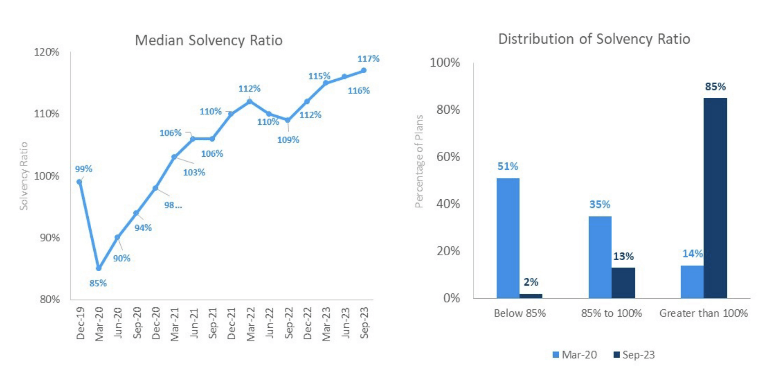
Source: Financial Services Regulatory Authority of Ontario, www.fsrao.ca. © King's Printer for Ontario, 2024.
For many plans, this may be an appropriate time to consider taking some de-risking actions:
- The funding position has improved for most plans, reducing incentives for risk-taking.
- The cost to de-risk has decreased given the increase in rates.
- Market volatility is high, with significant uncertainty.
For plans in a surplus position, the natural question is, “Now what?”
The De-risking Journey has Multiple Paths
A key de-risking lever for pension plans is to shift the asset mix from return-seeking toward liability-hedging assets, i.e., increase the allocation to assets that share similar characteristics as pension plan liabilities. But what is the right composition of liability hedging assets? There is no single answer to this question and more attention is warranted as the liability hedging asset allocation grows.
In general, liability hedging assets have predominantly been invested in investment-grade bonds, with a strong bias to government sectors, notably provincial bonds. Over time, a number of trends have emerged: 1) the increased adoption of overlay strategies that improved capital efficiency, 2) increased emphasis on corporate bonds and certain income-focused alternative assets with a focus on yield enhancement, and 3) the inclusion of annuities as a plan asset to support retirees.
The remainder of this article will explore some of the trade-offs between alternative liability hedging strategies. The application will focus on retiree liabilities, which is often thought of as a natural area to direct important de-risking actions.
De-risking Retiree Liabilities Through Annuities
Buying annuities allows a DB pension plan to pay a known upfront cost to transfer risk to an insurer. It represents a reasonable anchor to compare alternative strategies.
As plan sponsors rationalize the cost of an annuity purchase, a natural starting point may be to compare the yield implied by the annuity price relative to that offered by a matching portfolio of investment-grade public bonds (i.e., another “low-risk” alternative).
Rate of Return Offered by Annuities
Each quarter, the Canadian Institute Actuaries (CIA) surveys a group of insurance companies to obtain annuity quotes on hypothetical pension groups and supplement with pricing data for actual group annuity purchases.
The Annuity Purchase Discount Rate (APDR) is the unique rate that discounts the projected retiree payment cash flows, based on a set of mortality assumptions prescribed by the CIA, back to the premium. The APDR is illustrated in Figure 2 below relative to the yield of a bond portfolio with similar duration.
Figure 2
Evolution of the APDR Versus a Bond Portfolio Yield with Similar Duration 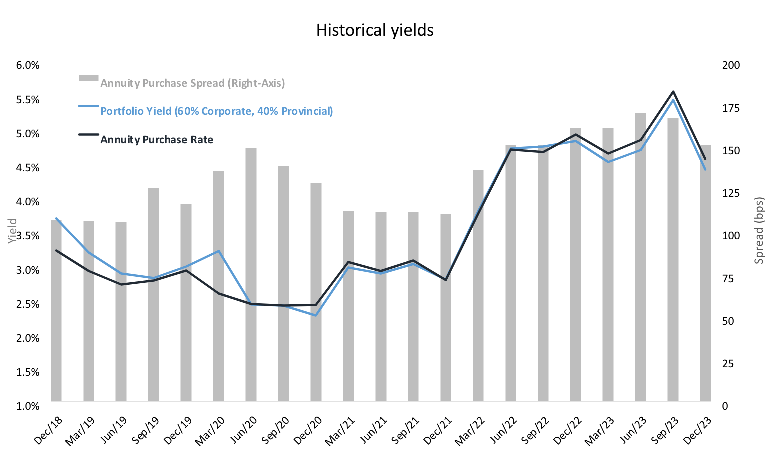
Notes: The yield shown is the internal rate of return net of management fees. Annuity purchase discount rates based on CIA guidance for a plan with a duration of 10 years at the end of each quarter.
Sources: Financial Times Stock Exchange (FTSE); Canadian Institute of Actuaries’ Assumptions for Hypothetical Wind-Up and Solvency Valuation Guidance Notes.
As can be seen in Figure 2 above, over the last five years, the APDR has been broadly aligned with the yield of a liability-matching bond portfolio made up of 60% corporates and 40% provincials. While this provides a reference point, it is not an entirely appropriate comparison:
- Liquidity: An annuity covers retiree benefit payments but cannot be included as part of ongoing portfolio rebalancing. This results in reduced rebalancing diversification benefits. Furthermore, buying annuities is an irrevocable decision that reduces flexibility to change the plan’s investment allocation going forward.
- Mortality assumptions impact the APDR: Life insurers have insight into mortality experience and trends and use their own mortality tables to derive the premium that would be charged. However, the APDR presented in the CIA guidance is based on generic mortality tables that translate the premium into a rate that can be used to support a valuation of retiree liabilities on a solvency basis. This may result in expected mortality gains or losses reflected in the APDR.
- Experience gains: An annuity purchase forfeits favorable experience gains relative to assumptions. While the reverse could be true, this risk is not symmetric for certain plans.
Quantifying the opportunity costs of annuities and how an annuity’s expected rate of return translates to a public bond equivalent is not straightforward. It depends on plan-specific factors and benefits from the insights of the plan actuary and an asset manager.
Plan sponsors may consider a broader set of de-risking investment options to reduce de-risking costs without materially compromising risk reduction.
Enhanced Liability-Driven Investing (LDI): Revising the Strategic Composition of Liability Hedging Assets to Reduce De-Risking Costs
The analysis below assumes that a 60% corporate, 40% provincial bond portfolio structured to broadly match the retiree payments is judged to be comparable to an annuity purchase in terms of expected return and stabilization of funded status.
Improving the return of such a liability hedging portfolio to engineer funded status improvements over time requires tweaks rather than an overhaul. Such an approach, referred to here as “Enhanced Liability-Driven Investing (LDI),” modifies the allocation to reduce de-risking costs, without materially compromising funded status stability.
What Strategies are Legitimate Sources of “Enhancement”?
The pension plan sponsor’s overarching objective is to reduce de-risking costs without compromising the liability hedging benefits. A typical convention for defining the opportunity set is to emphasize strategies that are similar to the liability, like those with more predictable cash flows or interest rate hedging benefits. Beyond public bonds, certain private credit and income-focused alternative strategies naturally come to mind. Instead, the investment opportunity set should consider:
- Liability duration: Longer-dated liabilities favor strategies that provide interest rate hedging benefits (e.g., longer-term fixed-rate private debt or assets backed by longer income streams). However, note that the public bond component can be reconfigured around privates to maintain a target duration, especially if bond overlay strategies are in scope.
- Investment horizon: A shorter horizon favors strategies with shorter queues and a limited redemption period, to avoid dilution of returns.
- Liquidity needs: The uncertainty level of liquidity requirements may favor certain fund structures (e.g., open-ended versus closed-ended funds).
- Regulatory requirements/incentives: May favor certain types of assets (e.g., resulting in lower provision for adverse deviations).
Case Study: Is an Enhanced Liability-Driven Investing (LDI) Approach Worth It?
To illustrate the concept of enhanced LDI, the return and risk profile of strategies structured to deliver an incremental 50bps and 100bps relative to a liability hedging portfolio of 60% corporate, 40% provincial bonds is compared. The latter is the anchor portfolio and its evolution deemed the retiree liability benchmark. While a number of “enhancement” sources could be utilized, the illustration assumes an allocation to private credit and real assets.
What does it Take to Enhance Return by 50 or 100 bps per Year?
As of Dec. 31, 2023, an allocation to private credit and/or income-focused real assets of 12.5 to 25% can help support a potential return enhancement (net of fees) of 50 to 100 bps. (See Figure 3 and Table 1 below)
Figure 3
Strategic Asset Mix to Achieve the Targeted Return 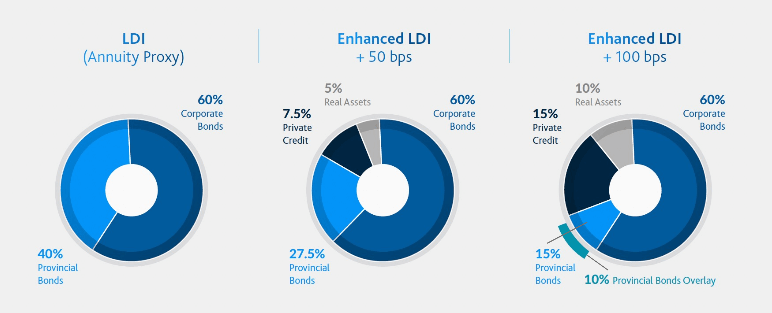
Table 1
Summary Characteristics of the Three Portfolios
| Summary Characteristics | |||
|
|
LDI |
Enhanced LDI |
Enhanced LDI |
|
Expected Return |
4.3% |
4.8% |
5.3% |
|
Expected Volatility |
7.7% |
7.7% |
8.1% |
|
Relative to LDI (Annuity Proxy) |
|||
|
Incremental Return |
- |
0.5% |
1.0% |
|
Tracking Error |
- |
1.1% |
2.0% |
Notes: Return, volatility, and tracking error are based on market consensus, yield curve conditions adjusted for potential downgrade and default risk, and market outlooks. The yield curve information is updated as of Dec. 31, 2023. Retiree liability duration is assumed to be 10 years. Private credit deemed to be allocated in Fiera Private Debt Fund VII and Fiera Diversified Lending Fund. Real assets deemed to be invested in Fiera Diversified Real Asset Fund.
Incremental Return: Measures the expected excess return per annum after deduction of investment management fees.
Tracking Error: Measures the consistency of the excess return over time. For a given level of incremental return, a lower number means a more stable excess return from one period to the next and is generally preferable. It is formally calculated as the annualized standard deviation of excess returns.
Projection of Funded Status Over Time
To express the impact of an enhanced liability-driven investing (LDI) approach in more tangible terms, a distribution of investment outcomes was simulated for each portfolio, and translated into funded status, starting from an initial investment of $200M and an assumed funded status of 100% at the end of Dec. 31, 2023. The evolution of the liabilities is approximated using the return of a liability matching 60% corporate, 40% provincial bonds portfolio. The distributions of funded status at the end of five and 10 years are shown below in Figures 4, 5; and Tables 2, 3.
Figure 4
Range of Funded Status for All Portfolios at Year Five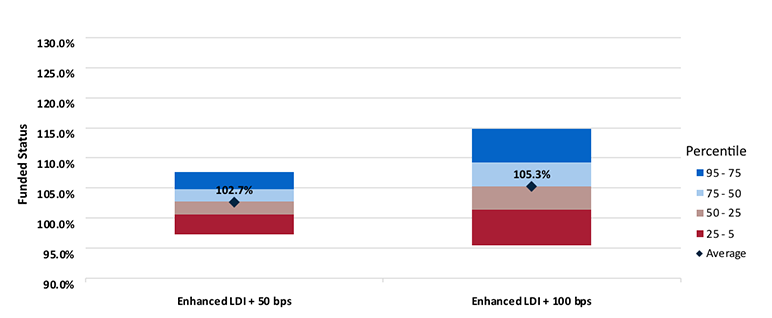
Table 2
Selected Statistics at Year Five
Five-Year Horizon |
Enhanced LDI + 50bps |
Enhanced LDI + 100bps |
|
Expected Increase in Funded Status |
+2.7% |
+5.3% |
|
Expected Accumulated Savings |
$5.2M |
$10.6M |
|
Probability of Funded Status Greater than 100% |
80.2% |
81.4% |
|
Average Funded Status in the Worst 10% Scenarios |
97.1% |
94.9% |
Figure 5
Range of Funded Status for All Portfolios at Year 10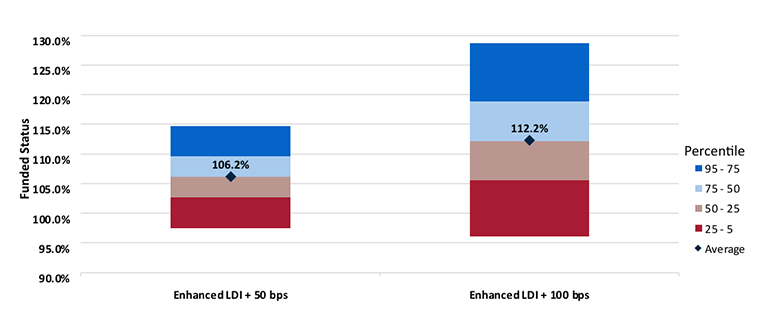
Table 3
Selected Statistics at Year 10
10-Year Horizon |
Enhanced LDI + 50bps |
Enhanced LDI + 100bps |
|
Expected Increase in Funded Status |
+6.2% |
+12.2% |
|
Expected Accumulated Savings |
$11.8M |
$24.1M |
|
Probability of Funded Status Greater than 100% |
88.0% |
89.1% |
|
Average Funded Status in the Worst 10% Scenarios |
97.0% |
95.1% |
Notes: Projections use 20,000 stochastic scenarios with assumptions based on market consensus, yield curve conditions adjusted for potential downgrade and default risk, and market outlooks. The yield curve information is updated as of Dec. 31, 2023. Retiree liability duration is assumed to be 10 years.
Based on these results, the following key takeaways are noted:
- The expected level of funded status improvements over both periods is consistent with the targeted outperformance. For example, the enhanced LDI + 100bps portfolio helps improve the funded status by approximately 5% over five years, or 1% per year on average. For an initial investment of $200M, this could represent more than $10M in savings.
- A higher targeted level of outperformance may be compelling for plans that are less risk averse (e.g., can fully recover the surplus) and have longer projection periods. For example, over a 10-year horizon, an enhanced LDI + 100bps approach provides materially more upside with limited downside. The longer timeframe allows the compounding of incremental returns to provide a larger buffer to absorb performance setbacks.
Other Benefits of an Enhanced LDI Approach
Generating additional return versus the liabilities, under a tight risk budget, can help to improve funded status outcomes. This could reduce the time to achieve full funding. For plans that are already well funded, any additional surplus generated could:
- Allow for ad-hoc benefit improvements (e.g., cost-of-living adjustment to retirees).
- Permit contribution holidays.
- Pay contributions in the DC component of the plan (as applicable).
Annuities can deliver unique outcomes to plan sponsors. However, there are liability-hedging solutions that support de-risking objectives while retaining flexibility and providing additional benefits across the entire plan.
Ensuring and Measuring Success
There are several practices that can help promote favorable outcomes with an enhanced LDI approach:
- Involving the plan actuary and investment professionals to ensure a broader appreciation of the liability-related implications of different scenarios and a compelling set of investment options tailored to the plan’s needs and circumstances (e.g., return objective, risk tolerance, preferences toward certain asset classes, time horizon, liquidity requirements).
- Having practitioners validate the funding implications of a change in investment strategy based on asset class experience and using sophisticated modeling tools.
- Having plan sponsors confirm that the liability valuation fully reflects the hedging benefits of the solution so that they manifest in funding outcomes.
- Establishing proper feedback mechanisms that monitor the achievement of objectives and help course correct when necessary. This should include monitoring of the funded position, relative performance, and prospective savings over time.
Statements of fact and opinions expressed herein are those of the individual authors and are not necessarily those of the Society of Actuaries, the newsletter editors, or the respective authors’ employers.
Maxime Carrier, CFA, CAIA, FCIA, FSA, MBA, is senior portfolio manager, fixed income solutions at Fiera Capital. He can be reached at mcarrier@fieracapital.com.
Martin Dionne, CFA, FCIA, FSA, is portfolio manager, fixed income solutions at Fiera Capital. He can be reached at mdionne@fieracapital.com.
Claude Lockhead, FCIA, FSA, is head of consultant relations, Canada at Fiera Capital. He can be reached at clockhead@fieracapital.com.