
Introduction of Cashflow Matching Strategic Asset Allocation Framework
By Gautam Devarashetty, Mandy Jiao, Joy Chen and Seong-Weon Park
Risks & Rewards, April 2024

The surge in interest rates over the past few years was primarily a regulatory response to global inflationary pressures, signifying a pivotal shift in monetary policy from that of the last 20 years. Leaving an era of historically low interest rates, central banks have embarked on a course of rate hikes to temper inflation, which has been running at multi-decade highs.
After raising the federal funds rate by 525 basis points since March 2022, the Federal Reserve noted in its December 2023 meeting that it is unlikely to raise rates further in 2024. The Fed's Open Market Committee (FOMC) members' aggregate view on the federal funds rate at the end of 2024 is projected to be 4.6% (median rate).[1] (See Figure 1)
Figure 1
Historical 10-year US Treasury Rates and Market Volatility[2, 3] 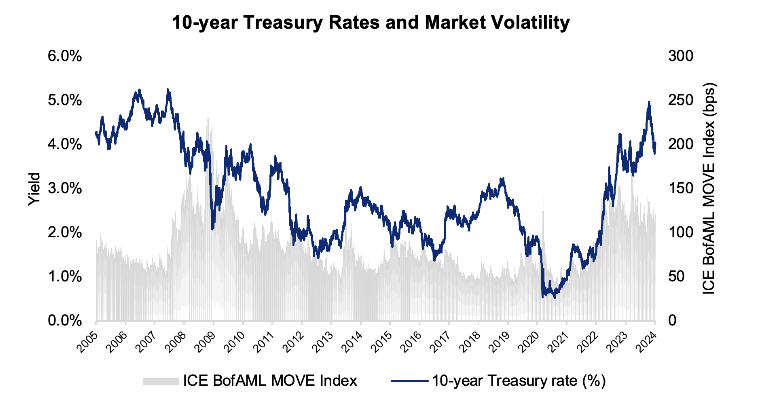
Source: https://home.treasury.gov/resource-center/data-chart-center/interest-rates/TextView?type=daily_treasury_yield_curve&field_tdr_date_value=2022
Over the past two decades, life insurers have faced significant challenges in generating investment returns that are necessary to support liability minimum guaranteed rates and maintain appropriate margins, due to the persistent low interest rate environment. Now that the long-awaited rate increases have become a reality, life insurers can enhance their asset and liability management (ALM) positions through asset rebalancing to narrow the duration gap and secure higher risk-adjusted yields.
Furthermore, in response to the growing emphasis on asset and liability cashflow matching by regulators and ratings agencies, life insurers are incentivized to strengthen their ALM practices. This includes reinforcing principle-based reserving and capital regimes, particularly in light of the growing allocation to illiquid assets.
Responding to this backdrop, this article introduces an insightful strategic asset allocation (SAA) framework that directly utilizes the cashflow mismatching level as the primary risk metric. It discusses how this framework empowers life insurers to effectively align the investment objectives across economic, regulatory capital, and rating agency requirements. In addition to exploring the practical considerations surrounding the implementation of this SAA framework, an illustrative case study is included to demonstrate the effectiveness of the cash flow matching SAA framework.
Common Pitfalls in the Traditional SAA Framework
Under the traditional SAA framework, cashflow matching is often not the primary optimization objective but rather an outcome of SAA analysis. This frequently leads to the adoption of a "barbell" investment strategy aimed at maximizing correlation benefits. The resulting SAA analysis is heavily assumption driven and sensitive to small changes in market conditions, which poses challenges in portfolio construction and investment management.
The investable asset universe is also constrained to a small set of representative asset benchmarks, which introduces basis risk. Investment managers must translate the highly customized representative asset benchmarks derived from the SAA analysis into the actual securities that they can buy or sell in the market.
These shortcomings have become even more pronounced, as regulators and ratings agencies place greater emphasis on tight cashflow matching between assets and liabilities.
To enhance insurance companies' liability-driven investment process, an SAA framework should prioritize cashflow matching as the primary optimization goal, considering each company's risk appetite and investment capabilities. Additionally, the framework should incorporate security-level asset information to assist portfolio managers in executing SAA seamlessly.
Introduction of Cashflow Matching SAA Framework
Modern technologies and tools have enabled life insurers to establish a robust and efficient liability driven SAA framework that fulfills the objectives listed below:
- Cashflow matching: Minimize asset and liability cashflow mismatch and reflect company’s own views and capacities on investments.
- Yield enhancement: Rotate assets to improve risk-adjusted portfolio yield.
- Capital consumption: Efficiently deploy capital under applicable capital framework (e.g., internal, regulatory and/or rating agency capital).
- Volatility reduction: Minimize uncertainty of capital and profits, and deviation from best estimate financial results.
- Readily executable investment strategies: Minimize any “translation” difference between SAA analysis and actual portfolio construction.
Key inputs to the cashflow matching SAA optimization algorithm include the externally projected asset and liability cashflows under various interest rate scenarios, plus the company’s disinvestment/reinvestment strategies, investment guidelines, risk appetite and target capital allocation to investment and ALM risks. The company’s investment opportunity sets sourced by investment managers will also be included to navigate yield enhancing opportunities.
The optimizer minimizes cashflow mismatch throughout the projection period at various target return levels, taking into consideration the company’s liabilities, capital, and liquidity position.
The optimized asset portfolio with security level allocation is then handed off to investment managers as a key input to asset rotation planning. The outcome directly translates to investment decisions (i.e., which assets and how much to purchase or sell). During this stage, several iterations of asset allocation refinements based on asset managers' inputs are expected to arrive at the final asset portfolio that balances the trade-offs between yield enhancement and additional capital consumption or other financial impacts. As investment managers receive security level SAA information, the refinements achieved through these iterations become more practical and efficient for inclusion in the final SAA that will be implemented.
Benefits of Cashflow Matching SAA Framework
Insurers continue to improve their ALM/SAA processes through implementation of a holistic process that connects all important activities from product sales, actuarial judgments/modeling, investment management and portfolio construction/rebalancing. The key merit of the cashflow matching SAA framework is to make this process a lot more practical and transferrable through all stages, resulting in more effective communication among the teams involved. Some notable benefits are:
- Greater attention to cashflow across all lines of business: This will encourage insurance companies to better understand their asset and liability profiles and think holistically in setting risk appetite, especially regarding decisions on illiquid investments.
- “Unbiased” SAA results: The cashflow matching SAA framework significantly reduces the reliance on “subjective assumptions,” which are often required for traditional asset optimization frameworks (e.g., long-term asset return assumptions, correlation assumptions, etc.). The cashflow matching SAA framework solely relies on relatively objective and market observable inputs, such as asset and liability cashflows and current market expectations on asset yields. As a result, SAA produces outcomes that are unbiased and robust, fitting well into insurance companies’ buy-and-hold investment models.
- Readily executable SAA results: The security level SAA offers portfolio managers greater transparency, enabling them to provide additional inputs and constraints to the SAA process and execute the selected SAA strategy seamlessly.
- Stable economic reserve: The improved cashflow matching results in stable economic reserves over time under principle-based reserving and capital regimes (e.g., U.S. NAIC asset adequacy reserves, BMA’s EBS technical provisions, Solvency II matching adjustments, etc.) due to significantly lower cashflow variations under various interest rate environments.
Conclusion
Implementing a robust cashflow matching SAA framework provides insurance companies with a solid foundation for their ALM and investment processes. This approach not only enables effective risk management but also allows for potential improvement in risk-adjusted return. By prioritizing cashflow matching and leveraging the security level SAA, insurers can navigate the complexities of the market with confidence and optimize their investment strategies.
Case Study
Company ABC, a global reinsurer, has a portfolio of structured settlements with liability cashflows extending up to 100 years with a duration of 12. Figure 2 shows the current asset portfolio predominantly consists of corporate bonds (57% of the total portfolio), followed by sovereign bonds (26%) and agency bonds (17%). Company ABC is assessing whether its asset portfolio can be optimized to improve its risk-adjusted return and cash flow matching level.
Figure 2
Snapshot of Current Asset Portfolio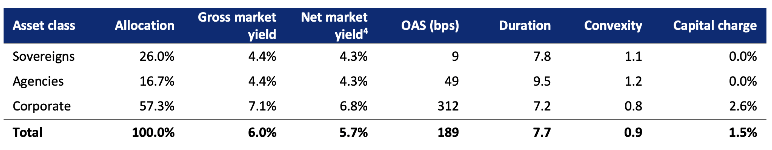
Company ABC defines its primary risk measure as the present value of cashflow mismatch and aims to minimize this measure throughout the projection period. The SAA optimization algorithm returns a set of optimized asset portfolios at various target yields with security level allocations, where the cashflow mismatch is minimized for any given target yield.
Figure 3 shows the SAA efficient frontier formed by a set of optimized asset portfolios. Each dot on the efficient frontier represents an optimized asset portfolio that offers the highest return for the given level of cashflow mismatch (i.e., risk). Cashflow mismatch increases in return for higher target yield as one moves up the efficient frontier.
Figure 3
SAA Efficient Frontier
Figure 4 shows the asset and liability cashflow profile by portfolio. The current portfolio has large excess positive cashflows in the first 10 years, followed by net negative cashflows in later years. The optimized portfolios show significant improvement in cashflow matching, especially during the first 30 projection years (i.e., fixed income investable horizon). This improved cash flow profile is the key driver of higher net asset yield for the balanced and yield enhancing portfolios.
Figure 4
Asset and Liability Cashflow Profile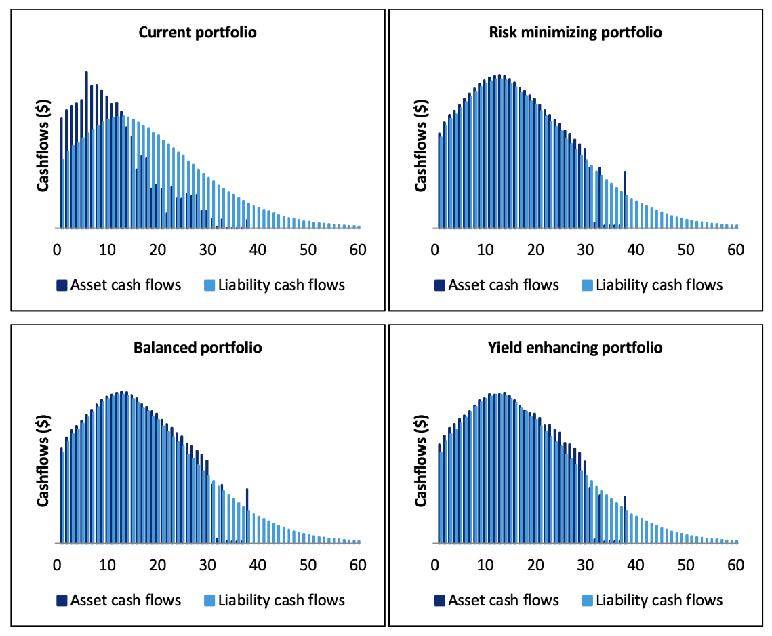
Figure 5 shows that the asset duration has been extended by 2.5 years with the improved cashflow matching optimization results. Moving from risk minimizing to yield enhancing portfolios results in a noticeable increase in capital charge, reflecting a shift in the portfolio's composition toward lower rated assets that have higher yields.
Figure 5
Key ALM Metrics 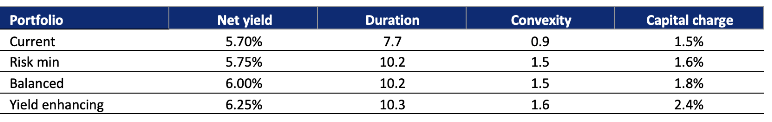
Figure 6 shows a shift in allocation from sovereigns and agencies to corporates as the portfolio yield increases. The gradual increase in the corporate BBB allocation is also consistent with the increased capital charge shown in Figure 5.
Figure 6
Allocation by Asset Classes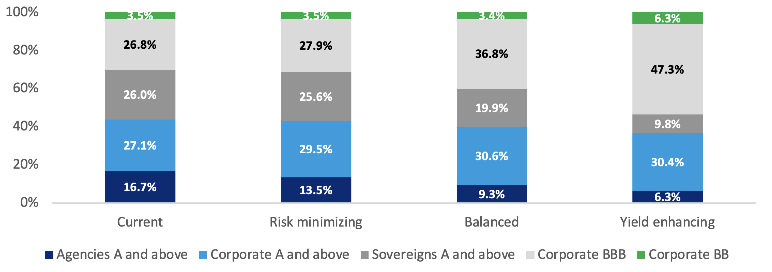
Figure 7 compares the yield attribution between the current and balanced portfolio. This analysis decomposes portfolio yield changes into the driving forces behind them. Separating the changes in asset allocation from the changes in yield for each individual asset class highlights where additional value is created. In this illustrative case, the main driver of the higher yield in the balanced portfolio is the allocation shift from sovereigns and agencies to corporate bonds, which extends duration by 2.5 years.
Figure 7
Yield Attribution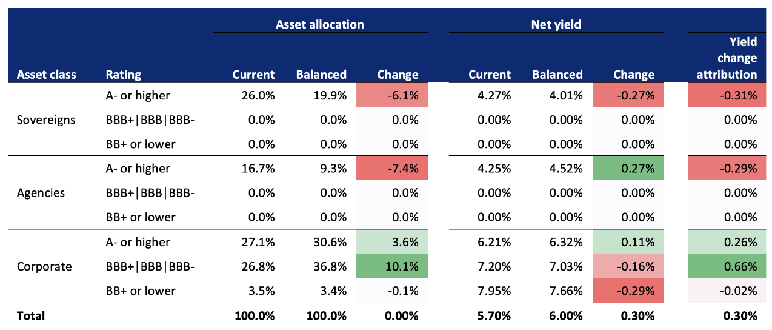
Statements of fact and opinions expressed herein are those of the individual authors and are not necessarily those of the Society of Actuaries, the newsletter editors, or the respective authors’ employers.
Gautam Devarashetty, FSA, FCIA, CERA is a manager at Oliver Wyman. He can be reached at Gautam.Devarashetty@oliverwyman.com.
Mandy Jiao is a manager at Oliver Wyman. She can be reached at Mandy.Jiao@oliverwyman.com.
Joy Chen, FSA, MAAA, CERA is a principal at Oliver Wyman. She can be reached at Joy.Chen@oliverwyman.com.
Seong-Weon Park, FSA, MAAA, is a senior principal at Oliver Wyman. He can be reached at SeongWeon.Park@oliverwyman.com.
Endnotes
[1] https://fred.stlouisfed.org/series/FEDTARRM.
[2] Source: Daily Treasury Par Yield Curve Rates from US Department of the Treasury; ICE BofAML MOVE Index.
[3] The ICE BofA U.S. Bond Market Option Volatility Estimate Index (MOVE) measures U.S. bond market yield volatility by tracking a basket of over-the-counter options on U.S. Treasury notes and bonds.