
Asset and Liability Management Strategies: Managing Convexity Risk as Interest Rates Rise
By Seong-Weon Park, Robert Winawer, Mandy Jiao and Su Su
Risk Management, September 2021

The recent sharp and volatile rise in long-term Treasury yields is causing concern for investors. We believe the same should be true of insurers.
During the first quarter of 2021, U.S. Treasury bonds sold off, resulting in a 71bps increase in 10-year yields until March 15th when the Federal Reserve System (Fed) cut its target rates to record historical lows of 0 percent to 0.25 percent. While financial markets have been given some breathing room to prepare for potential risks of rising inflationary and interest rates, the life insurance industry is long overdue for a reprieve from spread compression and reduced profit margins driven by the past decade of low rates.
While it is generally agreed that a modest increase in inflation and interest rates would be beneficial to the life insurance industry, a sharp increase in interest rates and the resulting tail risk can be quite the opposite. This article is intended to provide insights to the life insurance industry on how to prepare for what lies ahead.
Rising Interest Rate Environment—What is Unique This Time?
Rising interest rates are a normal aspect of the recovery phase of business cycles and are an indicator of overall economic growth. The unique aspects of this recovery and how volatility may unfold in light of inflationary pressures is highlighted in Exhibit 1.
Exhibit 1
Inflationary Factors and Financial Market Expectation
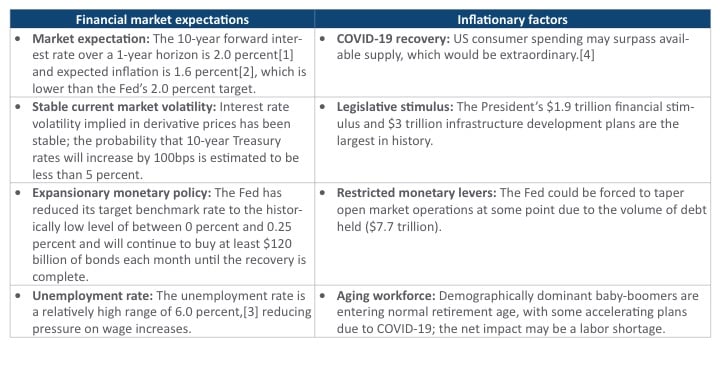
What matters most to the life insurance industry is interest rate changes, not inflation itself, although the correlation between inflation and long-term interest rates is high. The Fed’s monetary actions, such as setting the target benchmark rate and the decision of when to taper the bond purchase program, are more directly related to interest rate changes and would be more influential in the short term than other factors.
Sharp interest rate increases occurred in 2013 when the Fed tried to taper its bond purchase program amid the economic recovery from the 2008 global financial crisis. (see Exhibit 2)
Exhibit 2
10Y Treasury Rates and Market-implied Volatility
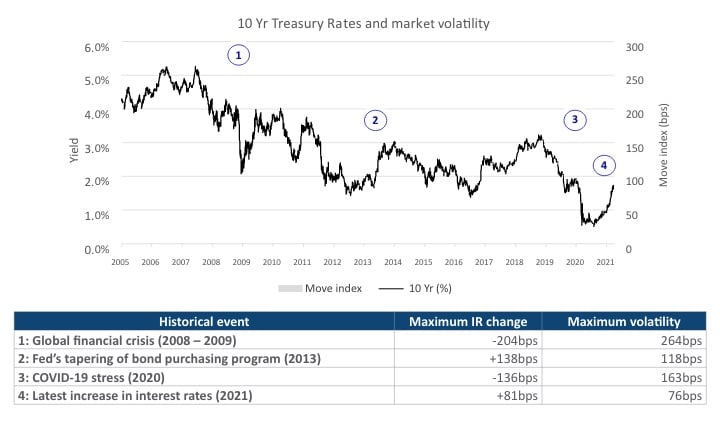
Exhibit 3 summarizes the capital market pricing of interest rate uncertainty risk over a 1-year risk horizon, based on market conditions and implied volatility as of May 12, 2021.
Exhibit 3
Treasury 10Y Forward (FWD) Rates Distribution as of May 12, 2021

While current implied volatility indicates a tight probability distribution of forward rates, the inflationary factors summarized in Exhibit 1 point to potential tail risk. An abrupt increase in interest rates may be triggered if consumers and corporations integrate inflation expectations into their decisions. The good news is that the life insurance industry has time to fine-tune its interest rate risk exposure through various management actions that are responsive to market signals. For the first installment of our rising interest rate series, we share our insights regarding “convexity exposure” and potential management actions from an asset-liability management (ALM) viewpoint.
Tail Risk—Convexity and Embedded Options
Since the 2008 global financial crisis, the life insurance industry has been responding to sustained low interest rates by adjusting guaranteed minimum crediting rates and selling more equity-indexed products with implicit low minimum interest rate guarantees. These lower liability guarantees have made insurance products more similar to banking products; therefore, policyholder behavior is likely to differ from that observed historically and predicted by actuarial models calibrated to those historical observations.
Most life insurance products include: 1) long-duration liabilities with fixed-guarantee rates, and/or 2) embedded derivatives held by policyholders. These two components make ALM challenging because liability cash flows may not be fully matched or hedged by financial instruments available in the market (i.e., unhedgeable risk), resulting in large liability cash flow convexity relative to rate changes. This large convexity means that liabilities become more costly regardless of which direction interest rates change. For example, with fixed annuities, more policyholders would stick with an existing policy when interest rates move down and the minimum guaranteed rate is higher than the market rate; however, more would lapse when interest rates increase, and more favorable alternatives emerge.
Prolonged low interest rates and low minimum guarantees mean that liability convexity today is higher than in the past. The challenge to managing this type of tail risk is two-fold: 1) policyholder behavior is difficult to predict (model risk), and 2) there exists a limited supply of assets to cover the liability convexity profile. As a result, measuring liability convexity is the first essential step to managing tail risk.
Measuring Liability Convexity
Liability convexity can be attributed to the following two metrics:
- Static liability convexity quantifies the change in liability sensitivity, in terms of the present value of best-estimate liability cash flows relative to changes in interest rates without incorporating dynamic lapse behavior. Static liability convexity increases with longer liability cash flows.
Exhibit 4 provides illustrative liability duration and static convexity statistics based on representative product cash flows.
Exhibit 4
Illustrative Liability Duration and Convexity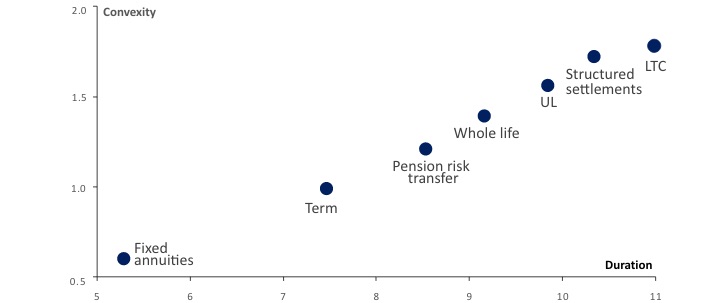
- Dynamic liability convexity quantifies the deviation from static liability convexity due to dynamic policyholder lapse. Given the uncertainty in how policyholders will react to rising rates, we recommend a stress testing approach to assess the impact of different levels of interest rate changes and dynamic lapse reactions.
A life insurance company can better understand its liability tail risk through this two-step attribution approach. The company is then able to rebalance its asset portfolio and implement a hedging strategy that manages the risk of loss under a sharp interest rate increase. While there is no single methodology for managing static and dynamic liability convexity, one approach is to: 1) match asset convexity against static liability convexity, and 2) use interest rate derivatives to mitigate dynamic liability convexity.
Dynamic Lapse Impact
Policyholders may elect to lapse an existing policy and redeploy the proceeds to other “new products” that offer better terms. The cost to the company varies depending on how sensitive policyholder decisions are to the difference between current product and new product terms; high sensitivity implies high liability convexity.
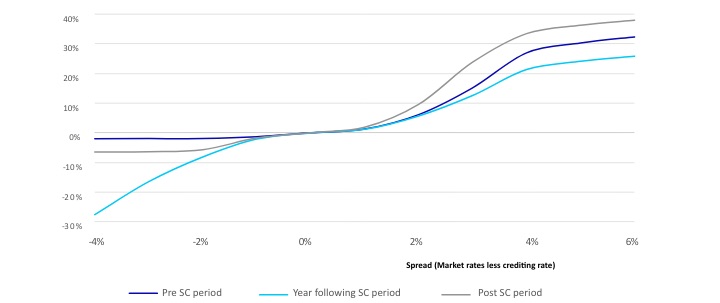
Exhibit 5 shows indicative lapse rate sensitivity to fixed deferred annuity competitive spreads. Our observations are as follows:
- Additional lapse rates are generally sensitive to positive competitive spreads in all cases.
- Additional lapse rates exist in the year following the end of the surrender charge period, even when negative competitive spreads exist.
- Policyholders do not react to small competitive spreads; lapse sensitivity increases when the spread widens (say by more than 100bps) in either direction.
- Lapse rates flatten out at extreme competitive spreads.
- Sensitivity is asymmetric; policyholders generally react more to uncompetitive product rates than to overly competitive rates.
- Lapse rate movements are also asymmetric; i.e., reductions to lapse rates are bounded by zero but increases to lapse rates are effectively unbounded (capped at 100 percent only).
- There is relatively little burnout (i.e., insensitivity of the remaining cohort due to prior selective activity) in existing blocks of liabilities today because rates have remained stable and low for a long time.
Exhibit 5
Illustrative Dynamic Lapse Rate
Dynamic lapse analysis requires a significant amount of judgment and inherent model risk.[5] Therefore, we recommend life insurers set a target convexity risk tolerance under prescribed interest rate shocks (e.g., 100bps or 200bps, etc.) and adjust asset and hedge positions to maintain convexity exposure within that risk limit.
Implications for Asset Allocation and Hedging
After liability convexity is estimated, asset convexity needs to be measured and adjusted accordingly. Optionality in callable bond and mortgage portfolios exacerbates life insurers’ convexity risk. When interest rates rise, the need for cash flow increases because policyholder lapsation increases while assets prepay less. We recommend life insurers understand how much capital is at risk due to open net convexity exposure both with and without optionality and on both sides of the balance sheet. The following table summarizes the life insurance industry’s overall asset allocation and relevant duration/convexity benchmarks. (see Exhibit 6)
Exhibit 6
Life Insurance Industry Asset Allocation[6] and Benchmark Indexes[7]
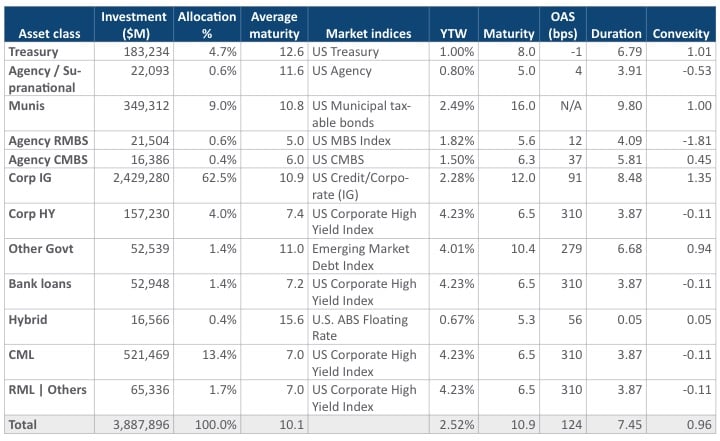
Exhibit 6 shows that the overall industry asset portfolio has less convexity than all liability types illustrated in Exhibit 5, with the exception of fixed annuities. A straightforward approach to improve convexity matching is to reduce exposure to asset classes that have negative convexity, such as Agency RMBS. In addition, the investment portfolio can be further optimized to match the asset convexity against the static liability convexity. Convexity risk associated with dynamic lapse behavior can be mitigated with derivatives. For example, interest rate caps and payer swaptions can be effective hedging instruments to mitigate dynamic lapse risk under rising interest rate scenarios. Puttable bonds can be used to compensate for rising interest rates whereas make-whole callable bonds do not provide a benefit under rising interest rates but can generally be used to improve asset convexity. (see Exhibit 7)
Exhibit 7
Assets and Derivatives That can be Used to Manage Risk Associated With Liability Dynamic Convexity
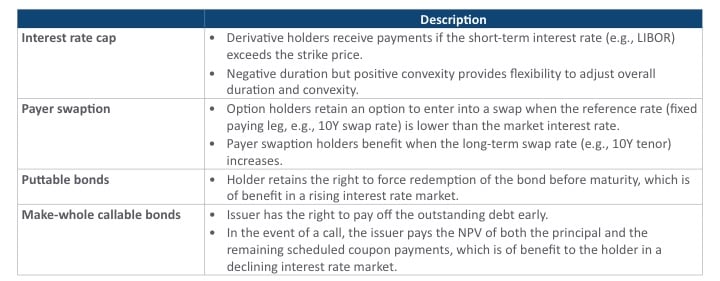
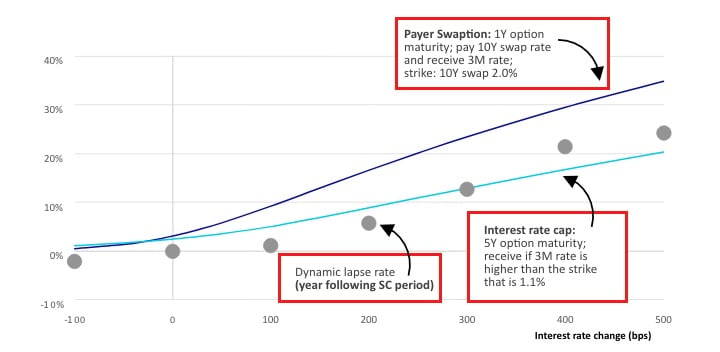
Exhibit 8 depicts market value sensitivities of representative payer swaption and interest rate caps as of March 31, 2021 market conditions. The option premium is about 2.5 percent (interest rate caps) and 3.0 percent (payer swaptions) per notional amount. Life insurers can determine the size of hedges by comparing the option payoff to the dynamic lapse tail risk.
Exhibit 8
Value Sensitivities of Interest Rate Derivatives[8]
Case Study: Convexity Matching
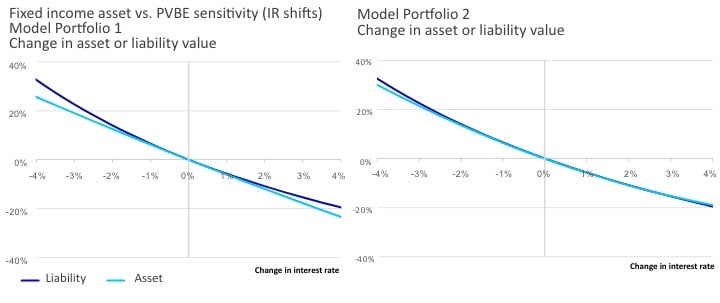
To demonstrate the benefits of a convexity matching strategy and how hedges can be used to reduce the tail risk of dynamic lapses, we have prepared a simple case study that compares a life insurance company that has a large convexity mismatch (Model Portfolio 1) versus another company with a convexity-matched portfolio (Model Portfolio 2). Results indicate that Model Portfolio 1 results in additional risk without additional reward. (see Exhibits 9 and 10)
Exhibit 9
Stress testing analysis for varying convexity matching profiles
- Liability profile: Fixed annuities with multi-year guarantees (MYGA).
- Asset Portfolio: two illustrative model portfolios with similar yield/duration but different convexity profiles.

Exhibit 10
Economic Value Analysis: ALM Sensitivity to Interest Rate Change
Dynamic Lapse Impact Under +300bps Interest Rate Change
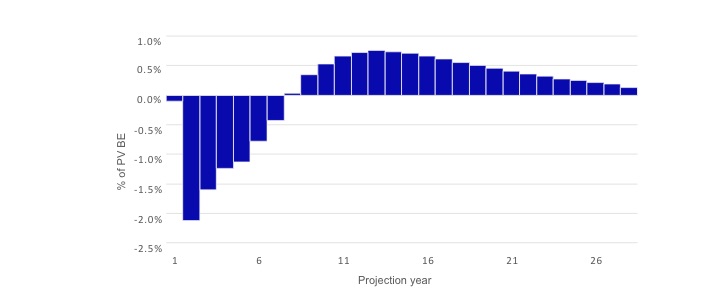
- Exhibit 11 shows potential changes in the liability cash flow profile relative to the baseline cash flows.
- It also shows that a significant amount of liability cash flows would be accelerated if interest rates increase significantly.
Exhibit 11
Dynamic Lapse Impact: Percentage of PV Best-estimated Liability
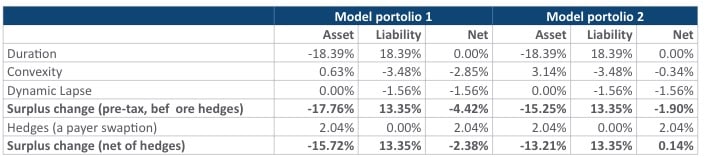
Risk Analysis Under +300bps Interest Rate Change
- The overall change in economic surplus value can be attributed to: 1) duration, 2) static convexity, and 3) dynamic lapse impact.
- Stress testing shows that the economic value of Model Portfolio 1 would decline by 2.5 percent more than Model Portfolio 2.
- Insurers can use dynamic lapse risk analysis to decide whether to further mitigate tail risk via derivatives, such as payer swaptions and interest rate caps, within a defined risk budget and tolerance level.
- The excess liability cash flow for interest rate increases of more than 100bps would be well covered by interest rate derivatives.
- Based on the option value sensitivities in Exhibit 8, the required hedge notional amount (a payer swaption) to offset losses from the dynamic lapse under the IR +300bps stress scenario is about 10 percent of the reserve amount.
- Hedge positions can be further tailored to reduce hedging costs while meeting the required payoff at the target tail.
Exhibit 12
Economic Surplus Impact: Attribution Analysis by Risk Factors
Conclusion
There are mixed signals from policymakers and financial markets regarding potential inflationary and sharply rising interest rate scenarios. In this article, we have shared our insights into convexity risk regardless of the direction of potential rate changes. The key takeaway is that life insurers are not compensated for taking convexity risk and it is the right time for insurers to review convexity exposure. There are different approaches available to mitigate convexity exposure through rebalancing of asset positions and hedges within each life insurer’s risk limits.
Statements of fact and opinions expressed herein are those of the individual authors and are not necessarily those of the Society of Actuaries, the newsletter editors, or the respective authors’ employers.
Seong-Weon Park, FSA, is a principal at Oliver Wyman. He can be reached at seongweon.park@oliverwyman.com.
Robert Winawer, FSA, is a principal at Oliver Wyman. He can be reached at Robert.Winawer@oliverwyman.com.
Mandy Jiao, FSA, MAAA, is a consultant at Oliver Wyman. She can be reached at mandy.jiao@oliverwyman.com.
Su Su, FSA, MAAA, is a consultant at Oliver Wyman. She can be reached at Su.Su@oliverwyman.com.
Endnotes
[2] 10-year expected inflation, Federal Reserve Bank of Cleveland as of April 2021.
[3] Bureau of Labor Statistics as of March 2021.
[4]CPI through May 12, 2021 has increased 0.8 percent, which is the largest 12-month increase since September 2008.
[5] A 2012 American Academy of Actuaries’ survey showed that less than 20 percent of life insurers used their own experience while most companies used either industry data (15 percent) or actuarial judgment (42 percent).
[6] S&P Market Intelligence, SNL data as of Dec. 31, 2020.