
Liquidity, Capital, and ALM: How Insurers can Include a Liquidity Score and Liquidity Stress Scenarios as Part of their Asset Liability Management (ALM) Protocol
By Wendy Wang, Xinping Yuan, David Wang and Josh Dobiac
Risk Management, December 2023

Editor’s note: This article first appeared on www.milliman.com and is reprinted here with permission.
On Friday, March 10, 2023, Silicon Valley Bank (SVB) failed after a bank run. As the Federal Reserve raised interest rates, depositor borrowing costs became higher, which led some SVB clients to start withdrawing money from the bank to meet their own liquidity needs.
Higher interest rates also led many savers at SVB to seek higher returns for their cash elsewhere.[1] SVB had invested mostly in long-term Treasury bonds, whose prices were falling as rates rose. To meet customer needs, SVB had to sell large holdings of these securities at depressed market values. This resulted in realized capital losses on SVB’s books. Prominent SVB investors, such as Peter Thiel’s Founders Fund and other venture capital firms, sensed the instability of SVB and advised their portfolio companies to pull money from the bank.[2] Customers started to withdraw as a result of fear. A bank run ensued.
For an actuary, what SVB went through was a classic asset-liability management (ALM) failure, where very short-duration liabilities were paired with much longer-term assets. It seems unfathomable to think that such a mismatch would ever happen in the life insurance industry, where duration matching is almost always a key component of ALM strategy. Also, the nature of life insurance and annuity products would make it harder for a large-scale bank run scenario to occur. Having to incur surrender charges, to lose tax advantage, and to go through underwriting again are just examples of specific product features that protect insurance companies from large-scale bank run scenarios.
However, a recent article published by Life and Annuity Specialist[3] suggests that the ratio of illiquid assets to total assets that U.S. life insurers own has been climbing, making it more difficult to generate cash if policyholders look to pull out money. While the probability or the scale of a bank run scenario for life insurance companies is arguably smaller than for banks, the increasing proportion of illiquid assets may still expose insurance companies to potential liquidity risk.
An adverse liquidity event can be viewed as an outcome of negative movements in the risks to which the business is exposed. For example, increases in interest rates can incentivize policyholders to surrender their policies and invest elsewhere, thus forcing insurers to secure liquidity under disadvantageous conditions and realize capital losses through sales of investments. Today, a typical way for insurance companies to evaluate and manage liquidity risk is to perform stress scenarios around this “negative movement” to assess the potential need for liquidity. This analysis, however, is often performed retrospectively (after a strategic decision has been made by the insurer) and independently from making other risk management decisions. It likely serves, at best, as a pass-fail test rather than directly influencing management decision making.
The probability of surrendering a policy (or bank account in the case of SVB), changes in asset values and liability values, and the liquidity of existing assets all play a role in determining potential liquidity risk, as depicted in the schematic in Figure 1. Insurance companies will have to take into consideration all these factors when they evaluate and monitor their liquidity risk.
Figure 1
Three Key Components of Liquidity Risk Management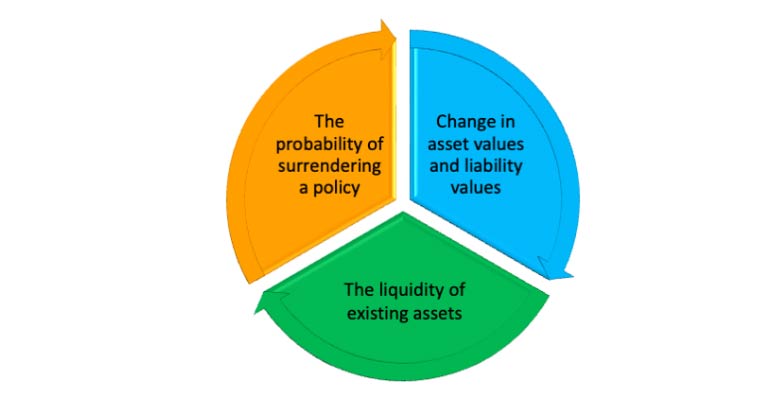
At the same time, these factors play a critical role in other issues that insurance companies have to manage, in particular capital levels and ALM. This would then suggest that the optimal way for insurance companies to manage their business is to move liquidity considerations up front as an integral component of making all risk management decisions on a holistic basis. As depicted in the schematic in Figure 2, the optimal place for an insurer to be operating in a fully integrated risk management framework is at the intersection of capital, ALM, and liquidity.
Figure 2
Integrated Management Framework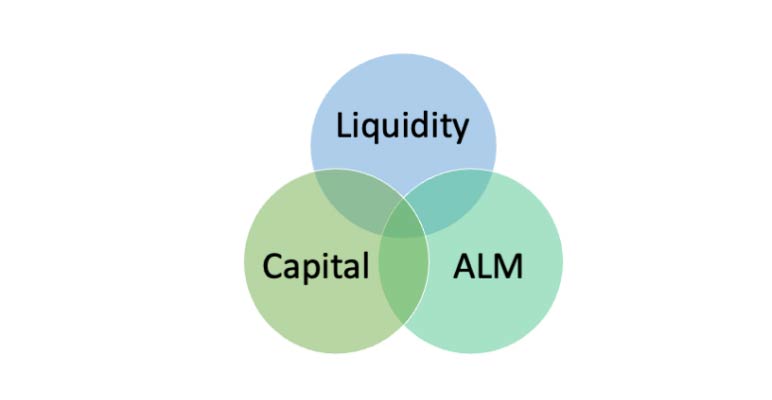
Liquidity and Capital
Capital is a measure of solvency margin, and capital can help companies withstand liquidity strain events, but it does not measure liquidity explicitly. Capital serves as a buffer against unexpected claims from policyholders and as a cover against financial losses from insurers’ asset portfolios. A company that holds more capital than others, assuming they carry very similar liability portfolios, is likely to be better positioned to handle liquidity needs. However, holding enough capital does not always imply that the company has enough liquidity for all future years. Capital could be invested in relatively safe but illiquid assets. So even with sufficient capital, insurance companies may still struggle to meet obligations due to lack of sufficient liquid assets.
Some capital regimes, such as Solvency II, explicitly consider the aforementioned three components (i.e., the probability of surrendering a policy, changes in asset values and liability values, and the liquidity of existing assets), but still the perspective is on solvency. They do not include a quantitative measurement or specific requirement for what a company’s liquidity position should be. It is undeniable that liquidity risk and required capital are interrelated—the exposures that make insurance companies prone to liquidity risk may have capital implications; enhancing the capital position may also help manage liquidity risk. But the question here is what the explicit liquidity need is given the specific liability portfolio. Capital provides no direct answer to it. Thus, it is not enough to just consider capital; it is essential to also consider liquidity.
We believe the key to measure liquidity is to segment the liabilities by those that are more liquid than others, scoring the liabilities by liquidity status (which we will refer to as the “Liquidity Score”).
One potential way of defining the Liquidity Score is to look at the change in cash flows within a short period of time. The formula below serves as an example, for a liability segment i:

where is the relative change in net cash flow* for liability segment i for a given projection period** given a 1% interest rate shock.
- Book Value of Cash and Invested Assets*** is the starting book value of cash and assets that are used to support liability segment i, before any interest rate shock.
* Net Cash flow = cash outflow (Surrender benefits, Death benefits, Withdrawals and other cash outgo) – cash inflow (Premiums and other cash income)
** Could be one month, three months, or six months, depending on the company liquidity policy and model capacity.
***Alternative definitions for the denominator could be used reflective of statutory accounting differences across jurisdictions, e.g., to use statutory reserves instead of book value of cash and invested assets.
Under this definition, higher Liquidity Scores indicate more liquid liabilities.
For liabilities that are driven by policyholder behaviors sensitive to interest rates, this definition of Liquidity Score captures cash flow changes that are due to both fund value changes and changes in the probability of paying out such funds. Similar definitions of Liquidity Score could be developed by applying shocks to different parameters or to more than one parameter in the Liquidity Score definition to account for liability outflows that are simultaneously driven by multiple factors. Defining Liquidity Score as a relative ratio standardizes the score and facilitates comparisons among products.
We believe that Lscore can help companies manage liquidity on a more granular level (i.e., product level) by identifying and differentiating the relative liquidity level of each product within the company's portfolio. It not only helps companies gain a deeper understanding of their product-level risk, but also enhances the decision-making process for investment strategies specific to individual products. Lscore can help companies make more informed and effective decisions regarding risk management.
Liquidity risk management is an ongoing process, so Liquidity Scores need to be updated on a regular basis. Insurance companies should analyze the distribution of the Liquidity Scores of their liability portfolios as well as the changes in such distribution over time. In an analog to key rate durations, measuring the Liquidity Score relative to nonparallel yield curve shifts might be helpful.
Integrating Liquidity into ALM
Now that we have quantified Liquidity Scores for different liability blocks, it is important to integrate liquidity into the ALM work. Insurance companies are long-term players in the financial market, and one of their key goals is to match assets and liabilities. Existing ALM frameworks usually only focus on matching the duration, or key rate durations, of assets and liabilities, which measures the changes in asset and liability values when interest rates change. However, ALM should also consider matching the most liquid assets to the most liquid liabilities. Liquidity matching may be as important as duration matching in the effort to achieve portfolio optimization.
However, liquidity risk management is not just about matching asset and liability liquidity but is a balancing act that recognizes a life insurer needs to manage multiple financial metrics. Holding too much or too little cash and cash-like assets could be equally harmful to insurers’ financial health and long-term sustainability. On the one hand, holding excess cash in hand today for liabilities that will come due in the future may lower the rate of return on the portfolio and lead to missed investment opportunities. On the other hand, holding too little cash and cash-like assets could potentially create issues with paying out claims on a timely basis. Thus, there will be some fine-tuning of the liquidity matching concept in making asset allocation decisions, e.g., consideration of credit ratings, target returns, etc.
In making decisions around liquidity matching, insurers should assess the needs for liquid assets over various time horizons and structure their assets accordingly to optimize the cash and cash-like assets holdings. The time horizon can range between one week (shortest) to the entire runoff period (longest), depending on the company’s liquidity policy. Over that period, assets should be matched with liabilities based on both duration and liquidity. Liquidity matching can build upon the Liquidity Score measurement introduced in the previous section.
The schematic in Figure 3 summarizes the steps involved in the asset-liability matching process.
Figure 3
ALM Process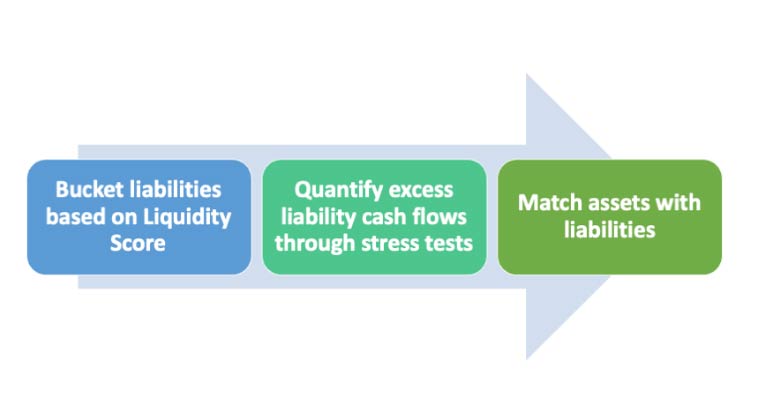
Elaborating on each step in the above:
- First, bucket liabilities based on Liquidity Scores.
- Second, use stress tests to quantify how much excess liability cash flows will arise from each liability bucket. Possible stress tests may include applying mass lapse scenarios. It should be noted that different mass lapse scenarios happen with different probabilities. The excess liability cash flows quantified in this step, in turn, should be associated with the probabilities. For example, if a mass lapse scenario has a very high probability of occurring, and there are large excess liability cash flows arising under such a scenario, then these excess cash flows would get a heavy weighting in making the decision as to how liquid the associated assets need to be.
- Third, match assets with liabilities. Duration matching and liquidity matching should both be considered in this step. A straightforward way to account for liquidity matching is matching the most liquid assets with the excess liability cash flows that arise from the most liquid liabilities. Again, emphasizing that liquidity risk management takes more into account, in conjunction with managing the business through multiple lenses. Other factors, such as asset rating and returns, also need to be considered in determining the optimal asset allocation for any given liability profile.
There are certain challenges to this proposed methodology.
In the second step, developing proper mass lapse scenarios can be a complicated process involving analysis of historical data, interest rates, and competitor actions, as well as predictions of policyholder behavior. All of this made particularly challenging as historical data may not be available to inform us of possible behavior for today’s product types under certain scenarios. For example, we may have seen very high interest rates in the late 1970s and early 1980s and have experience for policyholder behavior for products in force at that time, but no experience for how the new era of products will perform today in a very-high-rate environment. To address the challenges, predictive analytics can be an effective tool in modeling policyholder behaviors and developing appropriate mass lapse scenarios, as discussed further in the following section.
The third step requires collaboration with the investment team. The key is to model asset selling and corresponding transaction costs accurately and realistically, and to make sure there are adequate cash and liquid assets (on a market value basis) that can be sold quickly enough to meet the liability cash flow needs. It should also be anticipated that there will be several iterations of the model to ensure the correct balance is struck between pure matching and achieving the other financial goals of the company.
Allocating liquid assets to different liability blocks based on liability Liquidity Scores and achieving optional asset allocation will be an involved process. To do it successfully will require exploration, experimenting, monitoring, and ongoing improvements.
Policyholder Behavior
A very important component in quantifying liquidity needs is the probability of policyholders surrendering their policies. A typical solution is to use a dynamic lapse formula. Most dynamic lapse formulas are set on an aggregate population level. They cannot help insurers identify segments that are more liquid than others because they are usually mathematical formulas based on the economic condition changes only, although surrender charge rates are often considered. What actuaries often neglect is the important role of policyholder demographics in assessing the liquidity risk for different liability segments. For instance, among whole life policyholders, younger households and those with larger death benefits are more sensitive to economic downturns.[4] To measure the liquidity of different liability segments, insurers need to differentiate policies based on differences in policyholder behavior.
Predictive analytics offers ways to set policyholder behavior assumptions at a more granular level, which then enables segmentation. Better reinvestment opportunities may lead to higher withdrawals or surrenders from the in-force policy pool, but different policyholders may have different probabilities of taking such actions due to age, household income, health condition, and understanding of the economic movements. It is possible to use predictive analytics to foresee which policyholders, in a pool of in-force policies, have higher chances of surrendering (or withdrawing). Companies can then focus on the relationship management with these policyholders, with the goal of reducing their chances of surrendering, and thus reducing the company’s overall liquidity needs.
Predictive analytics also provides a probability distribution around the best estimate assumptions, which can be used in assessing probability of liquidity needs from different Liquidity Score buckets. This can help forecast a full picture of liquidity needs. For example, predictive analytics could model stochastic surrender behaviors by generating, say, 1,000 different scenarios and assigning probabilities for different surrender parameters. Insurers could then easily calculate the probability of a 10% surrender happening versus the probability of a 40% surrender happening. This is helpful in conjunction with utilizing Liquidity Scores for different liability segments. Insurers can be better prepared knowing the probability of the corresponding liquidity needs that arise from various surrender scenarios.
Conclusion
In general, insurance policyholders may have less incentive to surrender their policies during market turmoil as compared to bank customers. However, with insurance companies investing more heavily in riskier and less liquid assets in recent years, particularly during periods of low interest rates, liquidity risk should be an increasingly critical concern. To manage liquidity risk more effectively, insurers need to have a robust liquidity risk management framework in place.
Liquidity risk management should be a core part of an insurer’s enterprise risk management (ERM) framework and liquidity risk should be considered as part of all strategic decisions. The key to liquidity management is to ensure adequate financing to meet liquidity needs, in both normal and stress scenarios. Insurers should also consider incorporating the Liquidity Score into their ALM frameworks and include extensive suites of liquidity stress scenarios as part of their ERM frameworks. Predictive analytics should also play a role in estimating the probability distributions of stress scenarios.
Statements of fact and opinions expressed herein are those of the individual authors and are not necessarily those of the Society of Actuaries, the newsletter editors, or the respective authors’ employers.
Wendy Wang, FSA, CERA, MAAA, is an actuary with Milliman. She can be contacted at wendy.wang@milliman.com
Xinping Yuan, FSA, CERA, MAAA, is an actuary with Milliman. She can be contacted at xinping.yuan@milliman.com
David Wang, FSA, FIA, MAAA, is a principal & consulting actuary with Milliman. He can be contacted at david.wang@milliman.com
Josh Dobiac, LLM, JD, MS, CAIA, is a principal & risk consultant with Milliman. He can be contacted at josh.dobiac@milliman.com
Endnotes
[1] Christopher, B. (March 13, 2023). The collapse of Silicon Valley Bank: A one-off calamity, or sign of more trouble for California? Cal Matters. Retrieved June 1, 2023, from https://calmatters.org/economy/2023/03/silicon-valley-bank-collapse.
[2] Pollard, A. (March 10, 2023). Silicon Valley Bank Swiftly Collapses After Tech Startups Fle. Bloomberg Law. Retrieved June 1, 2023, from https://news.bloomberglaw.com/crypto/silicon-valley-bank-collapses-enters-fdic-receivership
[3] Smith, A. (March 22, 2023). Illiquid Investments Are Rising at Life Insurers as Bank Fears Persist. Life Annuity Specialist. Retrieved June 1, 2023, from https://www.lifeannuityspecialist.com/c/3989124/516414/illiquid_investments_rising_life_insurers_bank_fears_persist?referrer_module=issueHeadline (login required)
[4] Ma, M. (January 9, 2023). What makes people lapse on life insurance payments? PolicyGenius. Retrieved June 1, 2023, from https://www.policygenius.com/life-insurance/news/lapsation-risk-life-insurance/.