
The Rise of Registered Index Linked Annuity (RILA) products
By Nicholas Carbo, David Elliot and Ginaesan Sinnu
Product Matters!, August 2022

Introduction: Brief Annuity History and RILA Product Overview
“Necessity is the mother of invention.” This proverb characterizes the development, innovation and growth of the U.S. annuity market. The journey of every annuity type can be traced to a particular economic or regulatory environment.
Variable Deferred Annuities (VA) were launched in 1952 following a short period where inflation exceeded market interest rates. Fixed Deferred Annuities (FA) were reinvigorated in the 1980s when interest rates reached all-time highs.
Growth was spurred by the 1986 Tax Reform which made the deferral of earnings taxation until the funds are withdrawn more attractive.
Declining interest rates combined with a robust equity market led to the introduction of Fixed Indexed Annuities (FIA) in 1995. FIAs offer a good measure of protection but offer higher upside potential by linking interest credits to an equity market index, such as the S&P 500 (See figure 4).
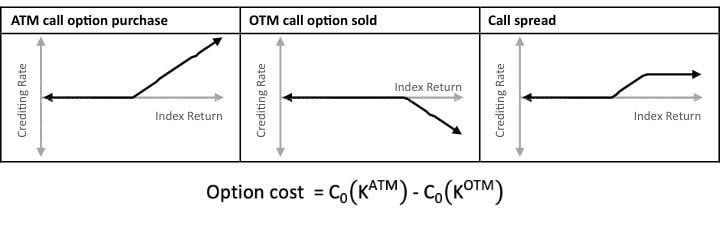
Background on FIAsThe simplest FIA is a 1-year point-to-point with a cap, where the insurer credits a rate equal to the return on an external index (e.g., S&P 500) at the end of a one-year period, floored at the minimum guaranteed crediting rate and capped at the cap rate. Insurers support this obligation by purchasing a call spread to replicate the liability. The amount available to the insurer to purchase the call spread is called the option budget, which is analogous to the interest credited on a FA. The call spread is comprised of a long at-the-money (ATM) call option and a short out-of-the-money (OTM) call option on the external index. Figure 1 illustrates the structuring of the equity options used in FIA hedging. Figure 1: FIA Call Spread Structuring
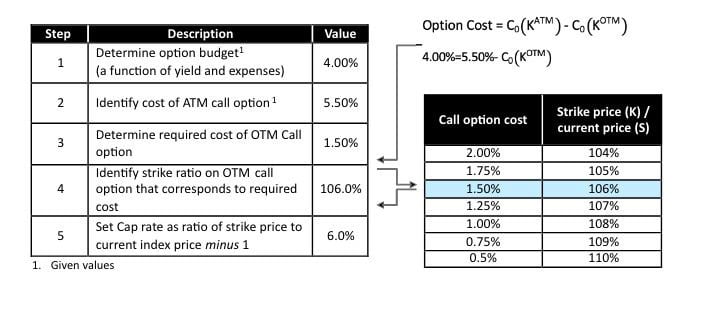
Determining the cap rate is a matter of solving for a strike price on the OTM call option such that the price of the OTM call option produces the desired net option cost, as shown in Example 1. Example 1: Solving for an FIA Cap Rate Given an Option Budget
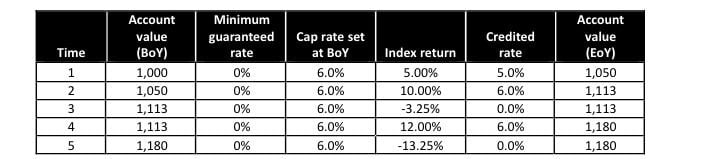
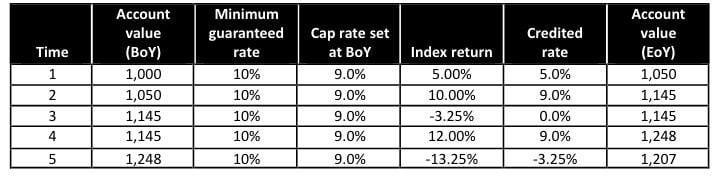
Table 1: Illustrative projected FIA index account
|
RILAs were introduced in the 2010s in a low-rate environment which was pressuring FIA caps and variable annuity guaranteed living benefits. RILAs enable higher caps in exchange for a risk of loss past a certain protection “buffer.” As the name suggests, the buffer absorbs the first X percent of loss (typically 10 percent to 30 percent), after which the excess loss is borne by the policyholder. For example, if the buffer is 10 percent and the market returns -5 percent, no loss is applied to the account value, whereas if the return is -20 percent, a return of -10 percent is applied to the account value.
Replicating the RILA return profile requires a short OTM put option in addition to the FIA call spread, with a strike price of (1-X percent) of the current index price, where X percent is the buffer rate. Figure 2 illustrates the structuring of options for a RILA buffer account.
Figure 2: RILA Buffer Account Option Structuring
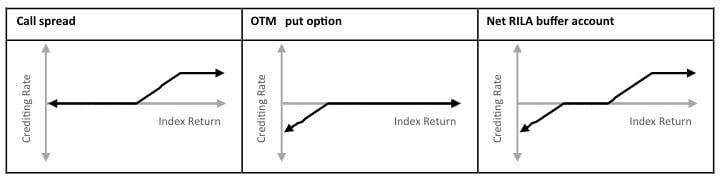
The equation of the option budget and the option strategy is redefined as below.
![]()
The short position in the OTM put option generates an inflow which is used to subsidize the price of the ATM call option, thus allowing the insurer to increase the strike price of the OTM call option, and consequently increasing the cap rate. Example 2 illustrates solving for a RILA cap with 10 percent buffer.
Example 2: Solving for a RILA Cap Rate
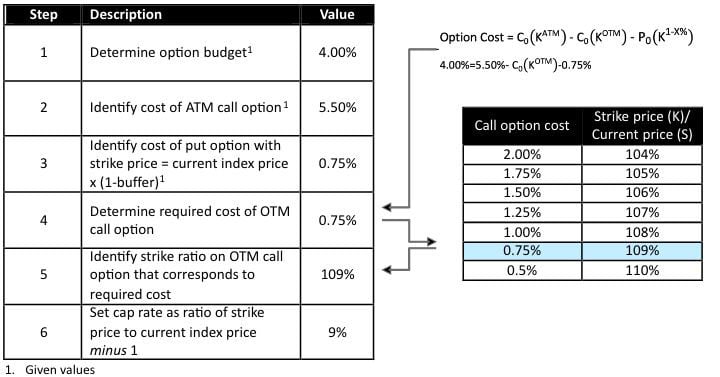
Table 2: Illustrative Projected RILA Buffer Index Account (10 percent buffer)
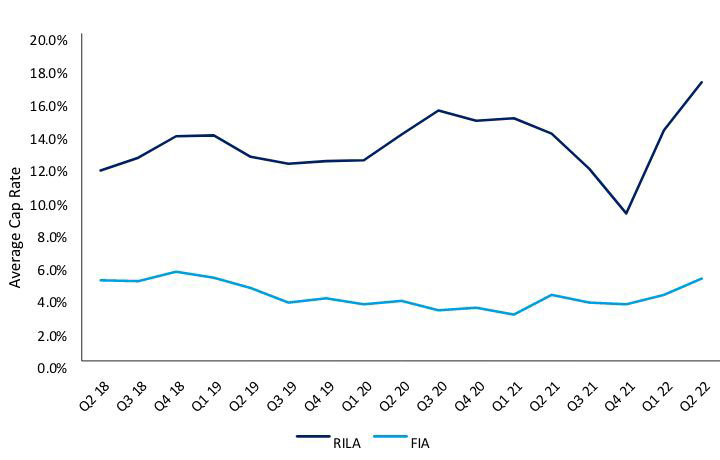
Strong cumulative returns in Table 2 illustrate the potential long-term upside provided by higher cap rates. A history of recent cap rates for RILA and FIA is shown in Figure 3.
Figure 3: Historical S&P 500 RILA (10 percent buffer) and FIA (0 percent floor) cap rates
The Rise of RILA Products
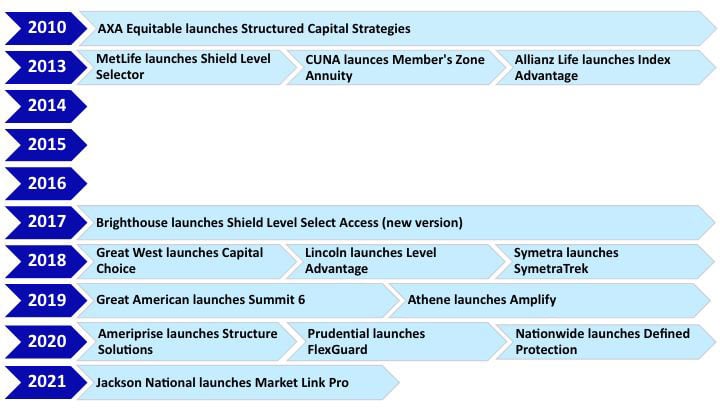
Equitable is considered the pioneer of the RILA market with the launch of the first buffered annuity, Structured Capital Strategies (SCS) in October of 2010. Despite being the first of its kind, SCS came with all the bells and whistles, ready to cater to a spectrum of risk appetite with one, three, and five-year point-to-point crediting segments and buffers of 10 percent, 20 percent, and 30 percent. In addition to providing a range of crediting structures, SCS was among the first to offer commodity indices, spurring the well-established FIA market to follow suit.
Other insurers soon joined the race in the emerging RILA market. Just as the evolution of the FIA and VA market, the growth of the RILA market was fueled by new offerings designed to stand out or outdo those already in the market. Figure 4 shows the entry of carriers into the market.
Figure 4: RILA Product Launches
The addition of new entrants, expansion of shelf space, and extended bull market have increased product acceptance and increased RILA’s share of the annuity market, as shown in Figure 5.
Figure 5: Annuity Sales by Calendar Year and Product
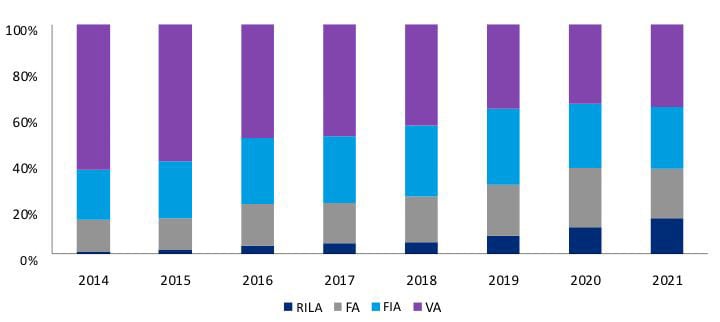
Source: LIMRA LOMA U.S. Individual Annuity Sales Study
While many insurers have entered the market, a handful of them have emerged to dominate sales. Large early entrants Equitable, Allianz, and Brighthouse continue to hold top spots, but LFG and Prudential are making significant strides. Together, these insurers make up more than 80 percent of the annual RILA sales, making the emergence of other significant players likely. Figure 6 shows the historical RILA sales by company.
Figure 6: RILA Sales Market Share by Company
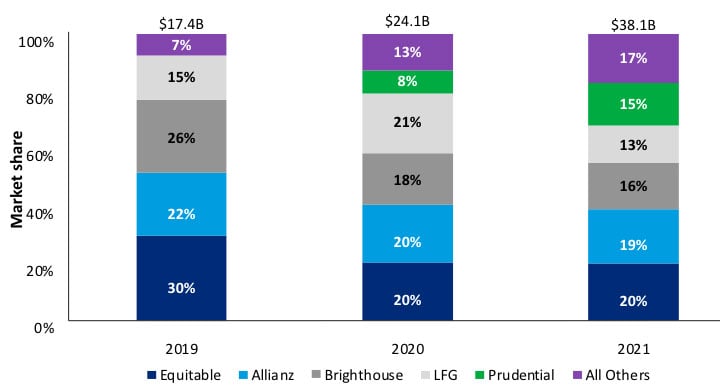
Source: Wink’s Sales & Market Report 2019-2021
Guaranteed Lifetime Withdrawal Benefits (GLWB) were recently introduced to differentiate offerings. GLWB market share is currently low, but likely to grow moving forward:
Figure 7: RILA Product Sales by Accumulation and GLWB Income Products
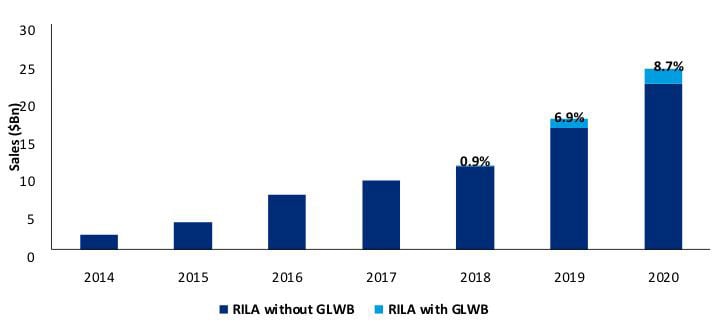
Source: LIMRA LOMA Variable Annuity Guaranteed Living Benefit Election Tracking Study
RILA Market Outlook
In the 1st Quarter of 2022 Multi-year guarantee annuities (“MYGA”) sales rose sharply, whereas RILA sales declined from Q4 2021.
Table 3: Q1 2022 Annuity Sales
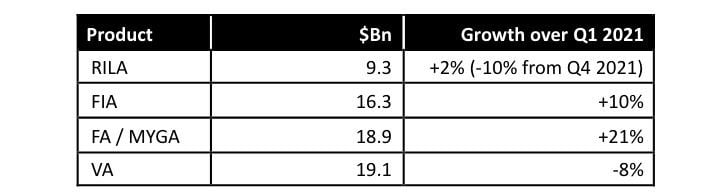
Source: LIMRA LOMA U.S. Individual Annuity Sales Study
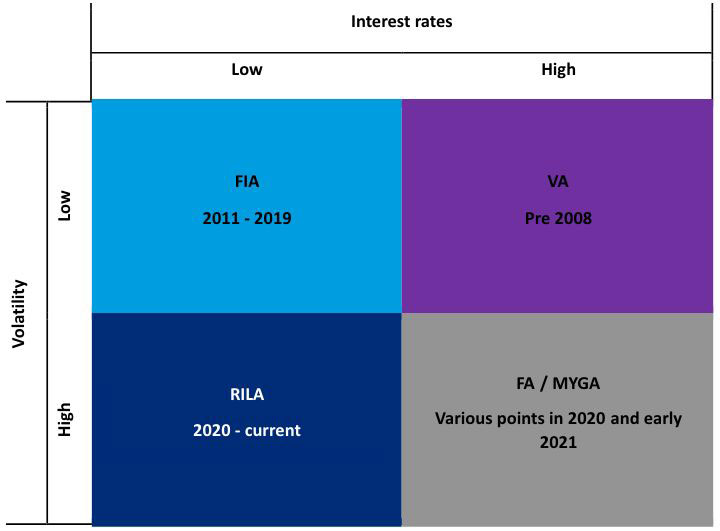
As shown in Figure 8, a rise in interest rates may a trigger a shift to FA/MYGA products and may even revive sales of VAs with guaranteed living benefits. A potential response of the RILA market to this trend would be to improve and emphasize GLWBs.
Figure 8: Product Attractiveness by Economic Market Cycle
Statements of fact and opinions expressed herein are those of the individual authors and are not necessarily those of the Society of Actuaries, the newsletter editors, or the respective authors’ employers.
Nicholas Carbo, FSA, MAAA, is a Principal at Oliver Wyman. He can be reached at nicholas.carbo@oliverwyman.com.
David Elliott, FSA, MAAA, CERA, is a Manger at Oliver Wyman. He can be reached at david.elliott@oliverwyman.com.
Ginaesan Sinnu, ASA, is a Consultant at Oliver Wyman. He can be reached at gin.sinnu@oliverwyman.com.