
The Impact of AG 49 and AG 49-A on Indexed Universal Life Insurance Illustrations: Results from a Survey of 28 Insurers
By Patrick OuYang, Karthik Yadatore and Paul Fedchak
Product Matters!, November 2022

The illustration of indexed universal life insurance policies (IUL) is a critical component of the sales process. Illustrations make it easier to explain to potential customers the potential performance of these complex products. They typically project the account value into the future, using various assumptions about the rate of growth of the account value.
With highly complex products such as indexed universal life (IUL), an infinite number of future outcomes are possible. The National Association of Insurance Commissioners (NAIC) Illustration Model Regulation seeks to provide standards for what can and cannot be shown to consumers. While insurers would like to illustrate the features of their IUL products and show account value growth rates that are justifiable, the NAIC regulations were no longer able to keep up with the new features. This combination concerned the industry and regulators for years.
To ensure a level playing field and to protect policyholders, the NAIC implemented Actuarial Guideline 49 (AG 49) in 2015, regulating illustration of IUL products.
This led to the growth of certain plan features that were not explicitly regulated by AG 49, such as account charge-based indexing, which produced an illustration advantage. The NAIC released the AG 49-A revision in 2020 to address these features. In short, AG 49-A was meant to ensure that products with enhancements such as multipliers, cap buy-ups, and so on would not show better results than non-enhanced products. AG 49-A standardizes the illustrated investment returns of IUL products by:
- Requiring that all IULs, with or without charge-based indexing features such as multipliers, have an appropriate and consistent illustration.
- Limiting the maximum illustrated Annual Rate of Index Credits to a single benchmark index account (BIA) for all index strategies. The BIA standardizes the lookback calculation for the maximum illustration rates. In AG 49, insurers could use a different BIA per index strategy in a given policy, but AG 49-A requires using a single BIA for all strategies.
- Specifying that BIA cannot exceed 145 percent of annual net investment earned rate (ANIER).
- For loans taken against a policy, reducing the difference in the loan interest rate credits and loan interest rate charges from 100 basis points to 50.
To understand the effects of these regulations on the life insurance industry, Milliman conducted a survey of 28 life insurers representing approximately 60 percent of inforce policies in the United States. The survey covered technology, regulatory, and business impacts on life insurance illustrations stemming from AG 49 and AG 49-A. This article provides a high-level overview of key findings from the report. The full report was provided to survey participants.
Survey results indicate that insurers are mostly satisfied with the current state of illustration regulation, although many of the comments provided to supplement the numerical scores suggested potential regulatory improvements. This indicates that there is appetite for improvement despite the relatively high level of satisfaction overall. Generally, companies do not believe that AG 49-A had a material impact on sales of IUL products.
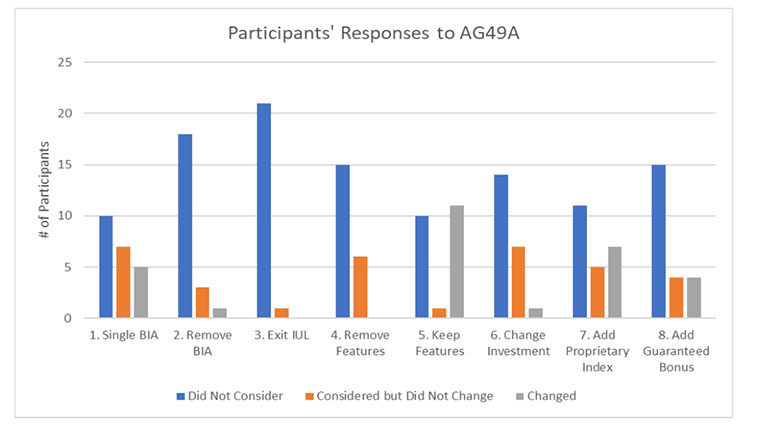
AG 49-A came into effect at the beginning of 2021. Respondents report a variety of reactions. A majority kept bonus and multiplier features that were a primary focus of AG 49-A updates. To stay compliant, they had to ensure certain features are no longer illustrated, and their illustrations are subject to the maximum illustrated Annual Rate of Indexed Credits, which represents the total annualized Index Credits expressed as a percentage of the account value.
The second-most-common response to AG 49-A was to add guaranteed bonuses.
Additionally, more than a quarter of respondents have added or refocused their products to use proprietary indices, and a similar proportion adopted a single BIA. About half of respondents indicate that they now offer a proprietary index with volatility control, and companies indicate more predictable index growth and lower hedge costs as reasons for offering these indices. Notably, many of these strategies were under consideration in response to competitive and risk management needs before AG 49-A was announced and implemented.
In our survey, participant responses occasionally offered commentary that while they have changed certain features, it was not necessarily in direct response to AG 49-A and/or that they already had such a feature prior to AG 49-A. Also, one additional company indicated that it is currently working on pricing a product with volatility control index.
Figure 1 summarizes participants’ survey responses to a question regarding their reaction to AG 49-A:
- Moving to a single benchmark index account (BIA) product.
- Removing the BIA from the product.
- Exiting the indexed universal life product market.
- Removing non-guaranteed bonus and multiplier features.
- Keeping bonus and multiplier features but illustrating within the confines of AG 49-A.
- Re-allocating assets or reconsidering reinvestment strategy that support the hedging budget.
- Adding or refocusing product to be based on a proprietary index.
- Adding guaranteed bonuses.
Figure 1
Participants’ Responses to AG 49-A
The survey also covered cap rate management practices. Managing IUL cap rates as a non-guaranteed element (NGE) have gained greater attention in the past few years, starting with the increased market volatility stemming from the COVID-19 pandemic. We found nearly two-thirds of companies evaluate inforce cap rates monthly, and almost all companies review them at least quarterly. Survey participants seem to appreciate the growing importance and association between illustrated values and non-guaranteed elements in times of unprecedented market volatility.
The cost of hedging is a major driver of cap rate setting. Most companies use historical hedging costs over a lookback period ranging from one to more than five years. Respondents were evenly split between companies that hedge life and annuity business holistically versus those that do not.
We also asked companies about the software they use for illustrations. Most companies reported being satisfied overall with their technology choices, with companies having more asset under management typically being the most satisfied. The range of responses was fairly wide, with some companies—mostly smaller organizations—reporting that they were less than satisfied with the solutions available. Most companies license their illustration software from specialty vendors, but a small number of companies have developed their own solutions internally. Those using homegrown software are usually larger companies.
Illustration software is a costly technology expense, with nearly half of companies spending more than $1M annually on it. Spending tends to be higher for companies with homegrown software. Notably, spending less was not correlated with lower levels of satisfaction. Companies highly value user friendliness and the ability to access software via the web and note that connectivity with other systems and mobile access are areas that could use improvement.
In closing, our survey shows that companies continue to adapt to the changing regulatory environment. The latest trend is toward an increasing number of proprietary indices being available in the marketplace, typically offered with a guaranteed bonus. Industry skeptics continue to question whether these trends are understandable to the common consumer. The efforts of the NAIC to ensure illustration comparability and fairness are having a measurable impact on the industry. However, these actions are not viewed as particularly onerous by participants, although recent discussions have considered whether more sweeping changes to the Illustration Model Regulation may help address industry challenges in ways that AG 49 and AG 49-A have not. The continual call for regulatory change and response of companies influencing and reacting to it does strain industry resources. While AG 49 and AG 49-A required non-trivial changes to illustrations and product design, the IUL market appears sufficiently attractive to compensate for the efforts.
Statements of fact and opinions expressed herein are those of the individual authors and are not necessarily those of the Society of Actuaries, the editors, or the respective authors’ employers.
Patrick OuYang, FSA, MAAA, is a consulting actuary at Milliman. He can be reached at Patrick.OuYang@milliman.com.
Karthik M. Yadatore, FSA, MAAA, is a principal and consulting actuary at Milliman. He can be reached at karthik.yadatore@milliman.com.
Paul Fedchak, FSA, MAAA, is a principal and consulting actuary at Milliman. He can be reached at paul.fedchak@milliman.com.