
What if Mortality Stops Improving? Introducing a Product Idea that Shares the Risks and Benefits of Changes in Mortality Rates
By Craig Reynolds and Aatman Dattani
Product Matters!, August 2023

Future mortality improvement has been a common assumption in life insurance and annuity pricing and forecasting for many years. However, experience over the last decade suggests this might be an assumption that merits reconsideration in the United States. This article will take a closer look at factors that impact mortality improvement trends and discuss why insurers may want to reevaluate product designs to better manage the associated mortality risk. We then introduce a product idea with this in mind, where premiums are based on a life expectancy index and insurers share the risk (and opportunity) or mortality improvement with policyholders.
U.S. Life Expectancy Historical Data
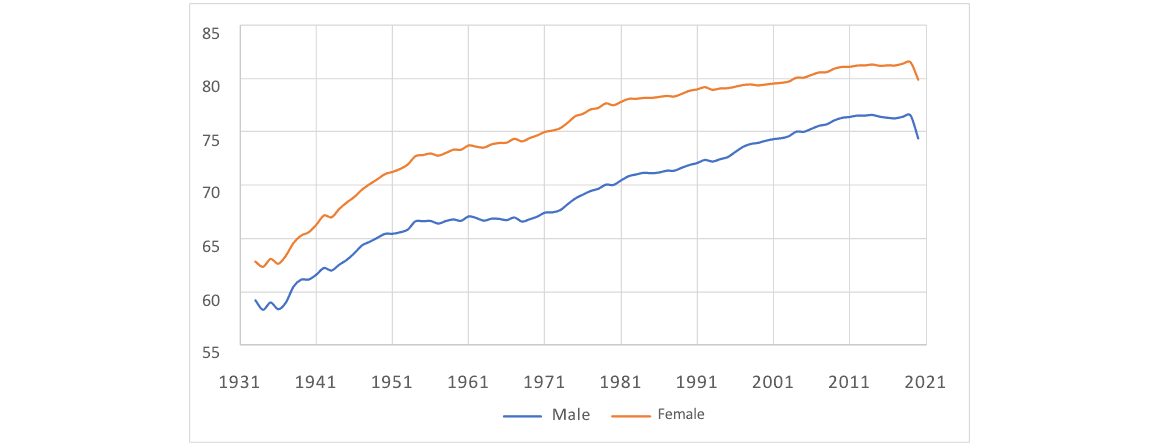
Figure 1 shows the U.S. life expectancy at birth by sex for the period 1933 to 2020, derived from the Human Mortality Database.[1]
Figure 1
U.S. Life Expectancy at Birth by Year
We convert these life expectancies into equivalent composite year-on-year mortality improvement factors as follows:
- Calculate a mortality scalar to apply to the mortality rates for all ages for each year such that the scaled mortality will reproduce the life expectancy in the following year.
- Calculate the year-on-year mortality improvement as one minus the scalar.
For example, a scalar to 2010 mortality rates of 0.9934, which corresponds to a mortality improvement factor of 0.66%, produces the same male life expectancy at birth as does the unscaled 2011 mortality. Of course, actual mortality improvement factors vary by age, but using this aggregate result allows easier analysis of trends.
Figure 2 shows the average of these derived mortality improvement factors for 10-year periods beginning in 1940. Several observations jump out:
- Mortality has generally been improving.
- Improvement rates have been volatile, while somewhat dampening over the last 30 years.
- Mortality got worse in the last decade, where we had multiple years with negative improvement.
- Much but not all of the deterioration in the last 10 years was due to COVID-19-related deterioration from 2019 to 2020. If we remove the deterioration of mortality from 2019 to 2020 (17.98% for males, 15.51% for females), the 2011–2019 average is 0.19% for males and 0.43% for females. It is interesting to note that life expectancy also declined between 2014 and 2017.[2]
Figure 2
Average Mortality Improvement by Decade

Unfortunately, past mortality improvement trends do not tell us how to predict future mortality improvement. Mortality trends are influenced by various factors and are impossible to predict with certainty, though some researchers have given this assumption a great deal of thought. See, for example, the demographic assumptions of the Social Security Trustees Report[3] or “Life Expectancy in 2040: What do Clinical Experts Expect.”[4] Some professional judgment will always be required. But we can consider various factors in making this judgment call.
The Case for Expecting Future Mortality Improvement
The easy argument for expecting future improvement would be something like the following:
Other than COVID-19 impacts, we have generally seen improvement for at least the last 80 years. We may not have good data before that but, again, we believe improvement was generally the case in earlier periods (barring events such as significant wars or pandemics).
Implicit in this argument is the idea that the drivers of past improvement will continue or be replaced by other factors. What are some of the factors that drove past improvement? A few include:
- Improving medical technology. The development of new vaccines, treatments, procedures, and technologies improved health outcomes and extended the life span of individuals.
- Improvements in public health initiatives. The implementation of public health interventions such as tobacco control measures, improved sanitation, and better access to clean water and air helped to reduce the incidence of preventable diseases and improved overall health outcomes.
- Improved automobile safety. Seatbelts, airbags, crumple zones, anti-lock brakes, and electronic stability control all undoubtedly contributed to an observed decrease in mortality rates, as did the decrease in speed limits.
- Declines in frequency of driving while impaired by alcohol or other drugs. Thanks in part to the effective efforts of Mothers Against Drunk Driving, rates of driving while intoxicated have markedly declined, with commensurate decreases in related mortality.
The United States has a lower life expectancy than many other countries. As the world gets more interconnected, we may learn and implement strategies employed elsewhere, helping push the expectancy up. Of course, all programs have diminishing marginal returns and, while it may be tempting to assume that the above-mentioned trends continue, there may be reasons to expect improvements from most of these factors to dampen, or even reverse, over time.
The Case for Expecting Future Mortality Deterioration
If the expectation for future mortality improvement is primarily based on the experience of past improvement rather than an underlying hypothesis for the drivers of the improvement, we run the risk of falling prey to the problem with induction described by David Hume, and later aptly summarized by Bertrand Russell:
Domestic animals expect food when they see the person who usually feeds them. We know that all these rather crude expectations of uniformity are liable to be misleading. The man who has fed the chicken every day throughout its life at last wrings its neck instead, showing that more refined views as to the uniformity of nature would have been useful to the chicken.[5]
Unfortunately, there are many contrary indicators that suggest that mortality improvement might at least dampen in the future, if not reverse. We see signs of this in the data for the 2010s above, where, even after removing the noted deterioration from 2019 to 2020, mortality is essentially flat over the prior nine years and life expectancy declined from 2014 to 2017. Below we recap a few reasons why deteriorating mortality might become the norm.
- Climate change. The goals of the Paris Climate Accords call for limiting the global temperature increase to 2 degrees Celsius. While that could happen, and we hope it does, even this level of increase could cause increased mortality over the next several decades[6] resulting from economic disruptions, spread of tropical diseases, natural disasters, pollution, resource depletion, and famine. If we fail in this effort, the effects will likely be worse. Human capacity to resist uncomfortable change in behavior is significant,[7] so there is ample reason to suspect that the impacts of climate change on mortality could be significant.
- Squaring of the curve. Death from disease when the bodies were otherwise largely functional was once much more common than it is in the United States today—Women and infants dying in childbirth. Dysentery. Smallpox. Polio. Measles. The list goes on. While this still happens for some diseases (notably cardiovascular disease and cancer), it happens less, especially in the developed world. But omega (the age at which the mortality rate is assumed to reach 1) basically has not changed. Virtually no one lived beyond age 120 a hundred years ago, or 1,000 years ago, and that is still true today. The survival curve is squaring off. U.S. life expectancy at birth has effectively doubled in the last 160 years,[8] but even if we cured virtually everything, eliminated all accidents, and had zero mortality through age 119 and then everyone died at 120, we still would not double life span again. Of course, we could invent some technique to reverse (or at least stop) the aging process, but it may not be wise to bet on this outcome. This trend is admittedly more a statement about limits to the increase in life span than it is a statement about limits to mortality rate improvement. It also does not suggest mortality deterioration. Rather it does indicate that there are limits to the continued increase in life span. It does remain plausible for mortality rates to continue to drive toward zero for ages before omega.
- Impact of Long COVID. Per the U.S. Centers for Disease Control and Prevention (CDC), some people who have been infected with the virus that causes COVID-19 can experience long-term effects from their infection, known as Long COVID. The CDC lists a variety of symptoms of Long COVID and mentions that people may develop symptoms that are difficult to explain and manage.[9] While the CDC released a report in 2022 showing the excess mortality attributed to Long COVID,[10] the report notes limitations on attributing mortality to Long COVID due to the long list of symptoms, the lack of clinical guidance, and the data limitations on past COVID-19 infections. It is very difficult to quantify the impact on mortality and mortality improvement of Long COVID; needless to say, it is and will likely continue to be, a headwind to factors contributing to mortality improvement. On the other hand, one can argue that there may be an offsetting mortality improvement as COVID-19 disproportionately impacted people with preexisting[11] conditions who likely had higher underlying mortality rates; additionally the hazard rate was significantly higher for people with more than one comorbid condition.[12]
- Population growth and a more mobile population. These factors are dramatically increasing our risk from previously rare or nonexistent diseases jumping from animals to humans. We have seen this notably in the last few decades with AIDS, bird flu, Ebola, COVID-19, and more. As our population grows and we push further into previously uninhabited areas, our human exposure to animal disease vectors increases. And we are so interconnected now that any new disease can spread from one isolated corner of the world to just about the whole planet within days or weeks. COVID-19 was certainly bad, but it is not the only pandemic in our history and it may not be our last. We might have or develop medical treatment or vaccines that could address any emerging disease, but they would not save everyone. They likely would not be sufficiently broadly available in a reasonable amount of time and could have side effects that also increase mortality. And it is likely some people would not accept the treatment or vaccine. While discounting the COVID-19 effects of the last few years as anomalies may have some validity, failure to consider the risk of future similar pandemics would be unwise.[13]
- Alcohol and drug abuse. The opioid epidemic has already had notable impacts on human mortality and may be a material driver of lower rates of improvement in the 2010s, including negative mortality improvement in the 2014–2017 period.[14] Unfortunately, we do not see signs of this trend reversing. Sadly, humans keep coming up with more and more lethal drugs.
- Wealth disparity. Greater wealth tends to lead to better access to medical care, sanitation, and nutrition, with associated increased life expectancy, though not always in a predictable, consistent, or uniform way. Even if we believe that economic growth will continue forever—an assumption that is already hard to justify—mortality improvement might not continue forever. A rising tide does not always lift all boats. A “permanent” underclass, which seems to be the trend in many countries, will not win from this greater access to medical care, sanitation, and nutrition.
- War. Of course, we cannot know what will happen here. But at least trends 1, 3, and 5 above arguably increase the risk of war. And due to “improved” technology, humans can be more lethal than we have ever been. In addition to extra deaths directly from war, supplies in and out of the countries involved (e.g., food, medicine, etc.) may become restricted and scarce.
Some of the factors above may apply less in the United States than in other countries, but as an interconnected society we are not immune to any of them. Some, notably trend 5, will likely apply more to the United States than other countries, as might the increasing trend in firearm and obesity-related deaths. Some will not apply to insured lives as much as they do to the general population. But there is at least one trend that will tend to make insured life mortality improvement worse than it is for the general population, and that is an increasing trend toward limiting the use of underwriting. It is already effectively banned in individual health. Casualty insurance already restricts credit scoring and other techniques that may have protective value. Genetic underwriting in life is already illegal in some states. Governments will decide which underwriting changes are appropriate, but they may all lead to increased insured-life mortality rates for new business.
What Can an Insurance Company do?
Insurers are in the business of sharing risk across a pool of policyholders. They are arguably better suited for, and more skilled at, covering the risk of fluctuation around the mean than they are at taking the risk that the mean changes. Unfortunately, when it comes to mortality for life insurance and annuities, insurers are taking on both kinds of risks. Given the fluctuation in mortality improvement observed over the last 80 years, one option might be to recognize that accurately predicting long-term rates of mortality improvement is very difficult. Therefore, rather than potentially mispricing products as a result of misestimating mortality improvement or deterioration, a company may consider a product that shares the risk with policyholders. The premiums would be designed to maintain lifetime profitability of the product. For example, if the population life expectancy changes from one year to the next, adjust the future premium rates to a new level amount anticipated to hold the lifetime profitability constant at the at-issue anticipated level. If mortality improves like it mostly has for the past 80 years, which we certainly hope it does, policyholders would pay less premium, benefiting from the improvement in mortality.
This product concept would allow insurers to reduce their risk. Policyholders also stand to benefit from such a product as they can participate in the upside if mortality continues to improve. While the downside associated with adverse mortality will not be attractive to potential customers, in situations of notable mortality deterioration, rates on possible replacement products will tend to be worsening, thus at least partially mitigating the risk of anti-selective lapse from an insurer standpoint. Though the implementation is different, and the scope of applicable risks is more limited, the concept of risk sharing is similar to participating life.
The above product is not like a par product, because it would adjust future premiums rather than policyowner dividends. And it is not a non-guaranteed element[15] because it is basing premium changes on an index rather than insurer expectations of future experience. But it might have similarities to both. Deriving the factors necessary to maintain profitability for a given set of assumptions at issue is a relatively straightforward modeling exercise, conceivably allowing an insurer to put the factors into the policy form.
This is not a perfect solution of course, notably because there is some degree of basis risk:
- Life expectancy at birth does not capture the pattern of mortality rate increases, and timing matters. (This could partly be addressed by indexing to age-specific, at-issue life expectancies.)
- Improvement will vary by sex and smoking status. (Again, this could perhaps be addressed by picking an appropriately granular index.)
- General population mortality data is more available than insured life mortality data, and more suitable as an index because of its objectivity and consistency, but less relevant.
Further, some care will need to be exercised to select an index of life expectancy that is likely to be stable and predictable for the long term, with contingency plans in place should the index be discontinued.
We believe this idea still merits consideration, as changes in population mortality can reasonably and effectively capture overall impacts of exogenous factors like those referenced in the prior sections.
An Example
We created a simple 30-year term plan model to test out this idea. Assumptions utilized for this exercise were intended to be plausible, but they do not tie to the assumptions of any particular company. In this model we attempted to derive premium adjustment factors to maintain profitability—as measured by the internal rate of return (IRR) on distributable statutory earnings over a 30-year period—after mortality rate changes. The base premiums were set to achieve a 12% IRR, assuming no future mortality improvement. Figure 3 shows what happens if mortality does not emerge consistently with expectations. In this example, we have assumed the opportunity and risk from mortality improvement are either fully shared or not shared at all between the company and the policyholder. In reality, a product could be structured to have different levels of risk transfer. Below, we show changes in profit emergence as improvement factors change, but, for a more relatable product, we expect that the changes will ultimately be expressed as a function of equivalent changes in life expectancy.
Figure 3
Profitability Sensitivity to Mortality Improvement
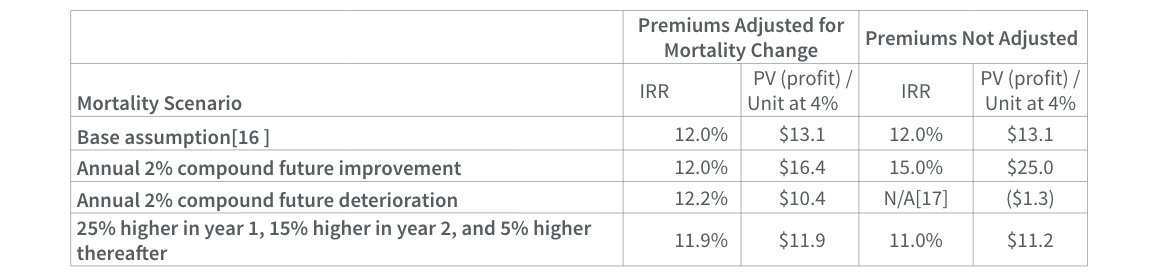
Note that the IRR is not always exactly 12% in the premium change scenario, as there are nonlinearities in the mortality sensitivity making it impossible to develop premium adjustment factors that are practically concise and exactly appropriate for all mortality scenarios. Also, our factors were chosen to maintain the IRR at the level anticipated at issue, but the resulting profit per unit remains modestly volatile. Other profit targets could be utilized instead. However, the results for the mortality-indexed product are much more stable than those of the level premium product, which can be very appealing from a risk management perspective.
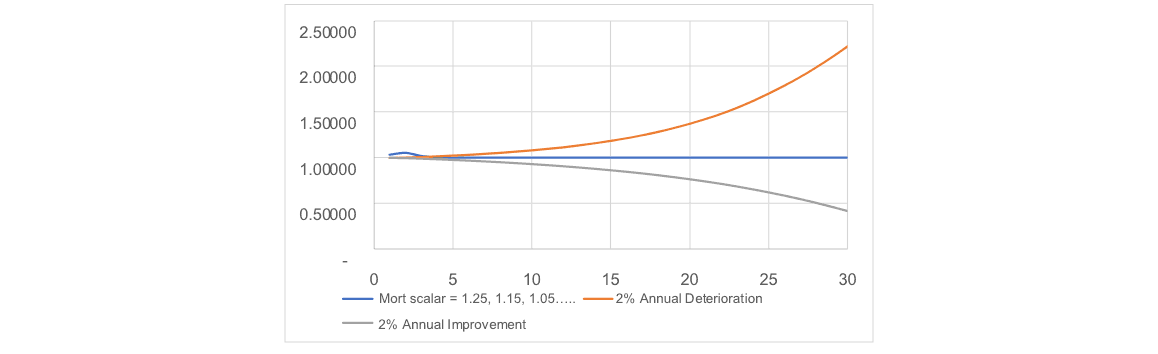
Figure 4 illustrates the ratio of the adjusted premium to the initial unadjusted premium for each of the three scenarios of mortality deviation represented in Figure 3. Not surprisingly, the continuous mortality improvement and deterioration scenarios dramatically illustrate the importance of the mortality assumption in setting a product premium.
Figure 4
Premium Adjustment Factor by Mortality Scenario
This analysis is preliminary and does not consider all factors that might be appropriate to consider in a true pricing exercise. Among them:
- Persistency might be worse for this product when mortality (as represented by the index) deteriorates and premiums increase. But we suspect this effect might be modest, as this is when people most need their life insurance. Persistency might be better for this product when premium rates fall, but this is a win-win situation for companies and policyholders. We have not modeled “dynamic” lapse rates for the mortality scenarios described above.
- We have not considered the impact due to principle-based reserves, limiting our analysis to utilizing Commissioners Reserve Valuation Method (CRVM) reserves. The deterministic and stochastic reserves for this product would clearly be higher than those of the non-indexed product when premiums have been reduced by the mortality indexing mechanics, and lower when premiums have been increased.
- Actual results will vary with the particular product specifications and assumptions. However, this concept could apply to virtually any traditional product, or even to cost of insurance (COI) rates on universal life (UL). In the latter case, COIs might be effectively structured as guaranteed index-linked charges rather than non-guaranteed elements.
Summary
There is much we cannot know about future rates of mortality improvement. Accordingly, misestimating this experience factor can dramatically impact product profitability, especially for term life plans.
A well-defined and carefully parameterized mortality indexed formula for adjusting premiums (or cost of insurance rates on UL) could materially reduce insurer mortality risk and reduce litigation risk by replacing judgment-based changes to policy charges with formulaic, contractually defined changes to such charges.
Statements of fact and opinions expressed herein are those of the individual authors and are not necessarily those of the Society of Actuaries, the editors, or the respective authors’ employers.
Craig Reynolds, FSA, MAAA, is a principal & consulting actuary with the life practice of Milliman. He can be reached at craig.reynolds@milliman.com.
Aatman Dattani, ASA, MAAA, is an associate actuary with Milliman. He can be reached at aatman@gmail.com.