
RILA GLWB Designs and Market Risk Analysis
By Matt Heaphy, Nicholas Carbo, and David Elliott
Product Matters!, June 2023

Introduction
This article assumes an understanding of Registered Index-Linked Annuity (RILA) and Fixed Index Annuity (FIA) products. An introduction to these products can be found in “The Rise of Registered Index-Linked Annuity Products” from the August 2022 issue of Product Matters!
RILA sales have been growing at a 47% compound annual growth rate (CAGR) from 2013 to 2021. Sales growth slowed to 5% in 2022 in the presence of rising interest rates.
Figure 1
Annual RILA Sales
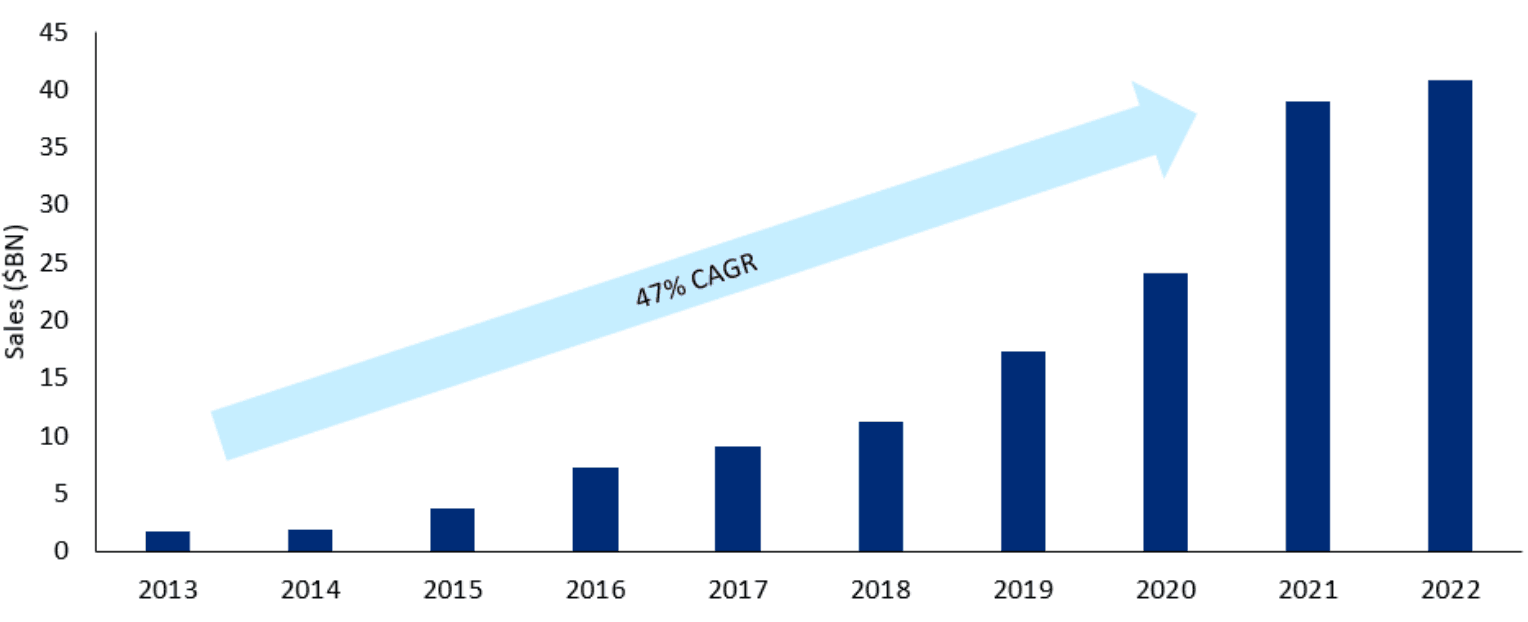
Starting in 2018, carriers began adding Guaranteed Lifetime Withdrawal Benefits (GLWBs) to their RILA offerings. These GLWBs have a wide range of guarantee levels and inherent risk to the issuing carrier. With slowing market growth, more carriers may launch GLWBs to stimulate sales. This article examines different types of RILA GLWBs with a focus on their embedded market risk.
RILA GLWB designs
RILA GLWBs fall into three major categories: account value benefit base, step-up only, and step-up and roll-up. All contracts begin in an accumulation phase wherein the customer’s lifetime income benefit has the potential to increase. When the customer elects to utilize the rider, the income phase of the contract begins, and the insurer starts making payments.
Table 1
RILA GLWB Designs
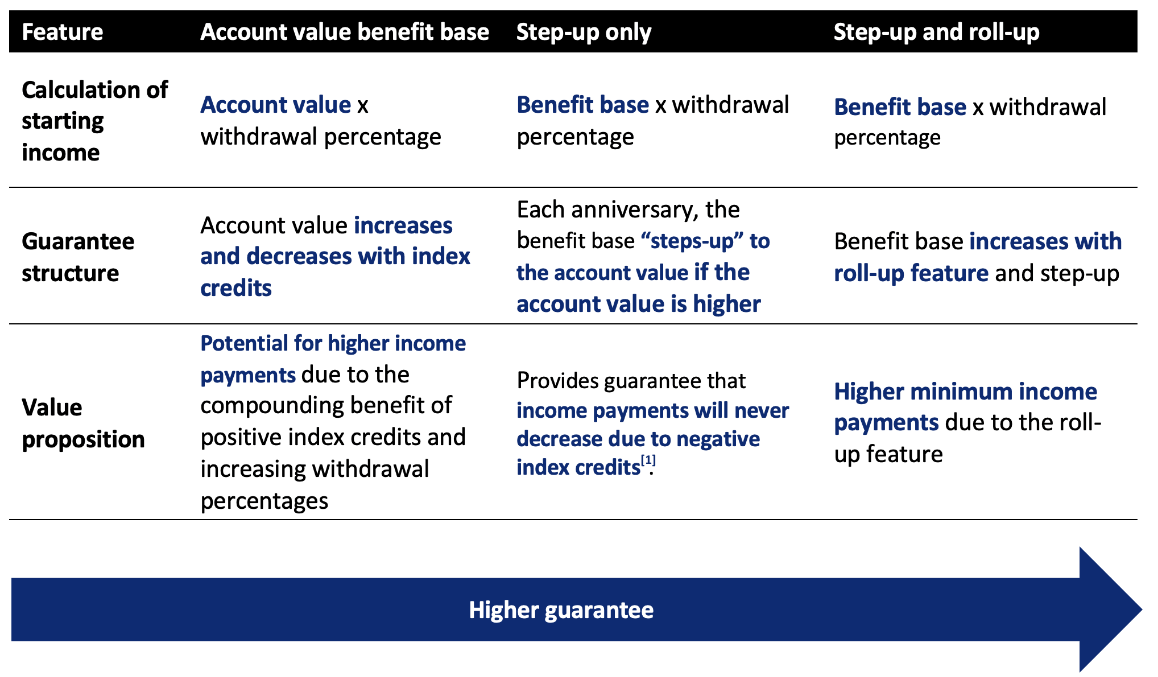 [1] Assuming no excess withdrawals are ever taken.
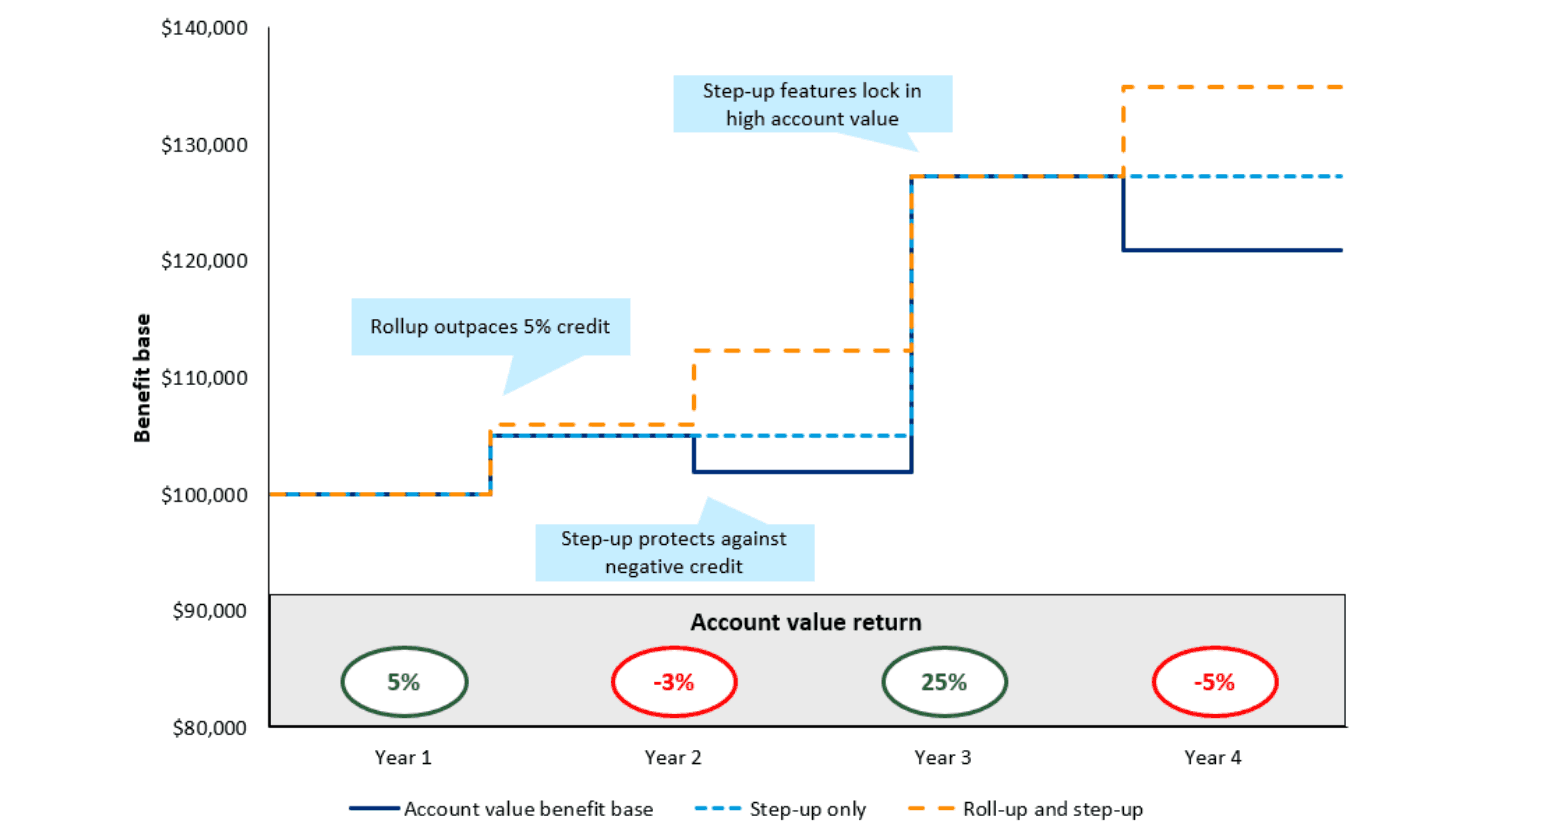
Figure 2 projects the benefit base for each design assuming a starting premium of $100,000. The roll-up is assumed to be 6% compound interest.
Figure 2
RILA benefit base illustration
Product Development History
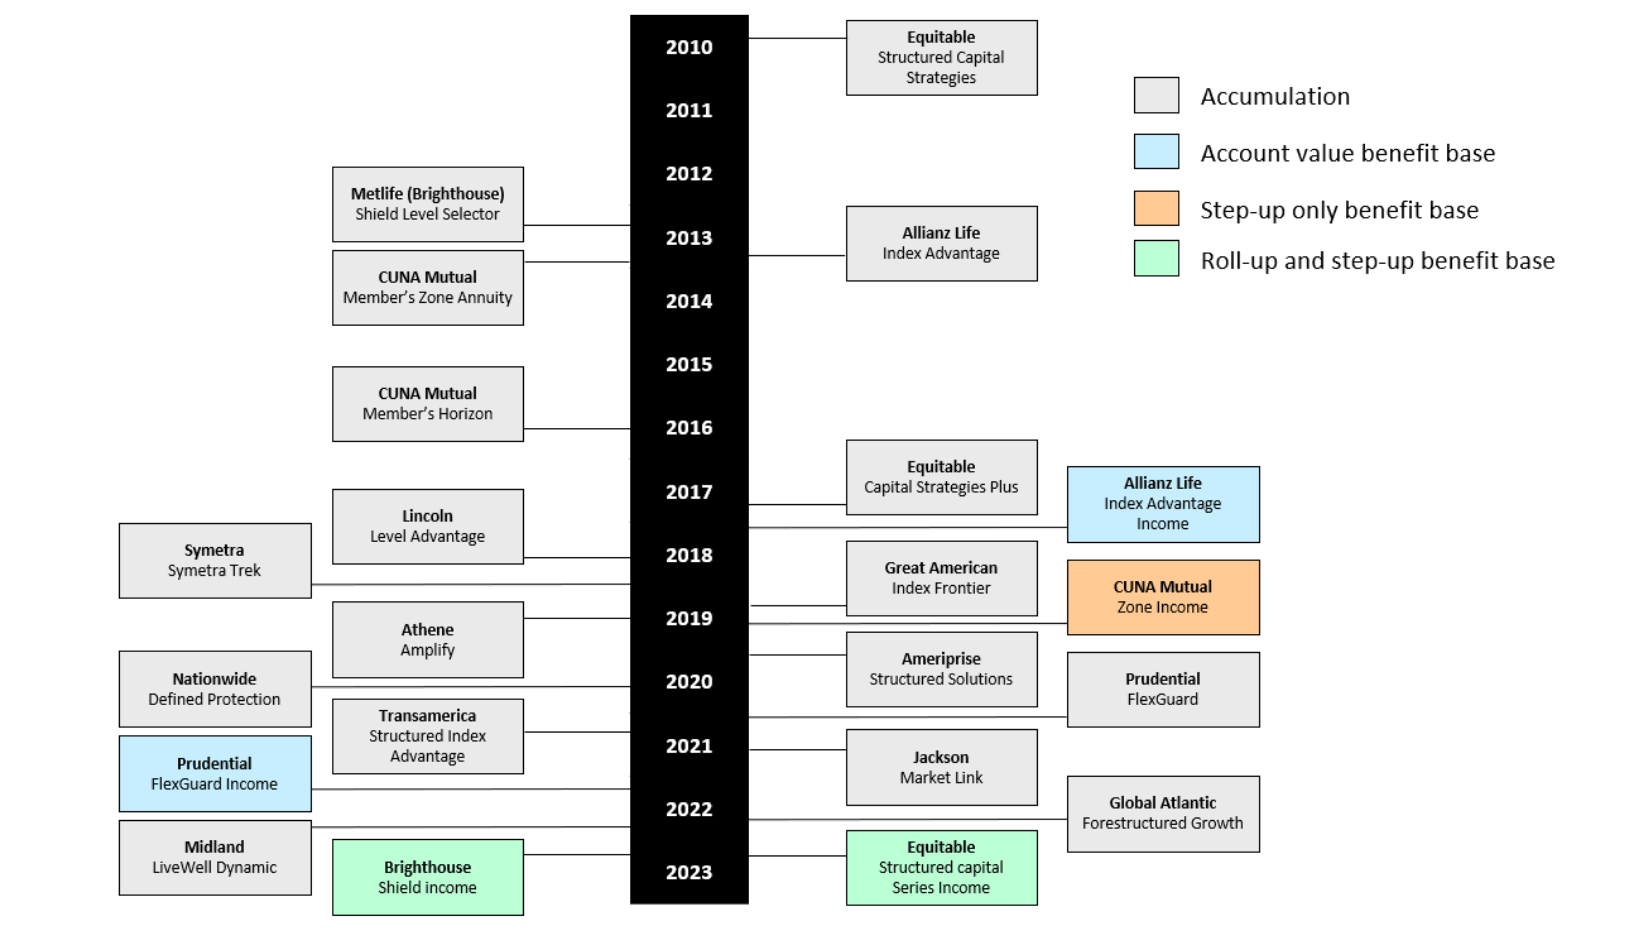
Given the growth in RILA sales, many carriers have entered the market. The first RILA GLWB was launched in 2018 by Allianz Life. CUNA Mutual, Prudential, Equitable, and Brighthouse have also launched RILA GLWBs. We expect additional carriers to follow suit to maintain their position in an increasingly competitive market.
Figure 3
RILA Product launch History
Key Risks
Adding withdrawal benefits to RILAs adds risks for the issuing carrier:
- Policyholder behavior: GLWB pricing involves assumptions for utilization of rider benefits and dynamic surrenders; profitability will vary if behavior is different from expected.
- Interest rates and reinvestment: withdrawal benefits extend the duration of the liability; long-term benefits are harder to duration match, which adds reinvestment risk.
- Index performance: RILA claims vary by index account performance. Carriers use hedging to mitigate this risk. The introduction of withdrawal benefits increases the complexity of hedging, especially for designs with a roll-up.
The remainder of the article focuses on index performance risk for RILA GLWBs, how it compares to FIA GLWBs, and the impact on index account value hedging.
Index performance and cost of funds analysis
A stochastic cash flow model was used to analyze contracts for a set of real-world scenarios. The model calculated cost of funds (CoF, defined below) over a range of long-term index returns. This metric is useful because (1) it serves as a proxy for the cost of the liability and (2) it is comparable across regulatory regimes since it makes no assumptions about reserves and capital.
Table 2
Sample product designs and key assumptions
|
GLWB |
Base contract |
Key assumptions |
|
Two designs:
Rider fee: 1.5% benefit base GLWB withdrawal rates: Solved to produce a 3% CoF |
Two annuity products fully allocated to a single index account:
|
Real world scenarios: 1,000 scenarios from the Academy Interest Rate Generator Dividend yield: 2% per annum Insured life: 55-year-old female beginning the income phase at age 65 Interest rates and crediting rates: assumed constant |
Results are presented three ways with various levels of hedging:
- Without hedging: Shows the variance in CoF before hedging is applied along with variability of claims paid to the policyholder.
- With hedging: Displays the CoF with hedging 100% of account value (a common approach for RILA and FIA without GLWB).
- Percent of account value hedged: A constant percentage of account value is hedged to reduce the correlation between CoF and index performance.
Figure 4 shows the relationship between average index performance in the first 10 years of the scenario set on the x-axis and the CoF for each design described above assuming no hedging on the y-axis.
Figure 4
Cost of funds versus index performance: No hedging
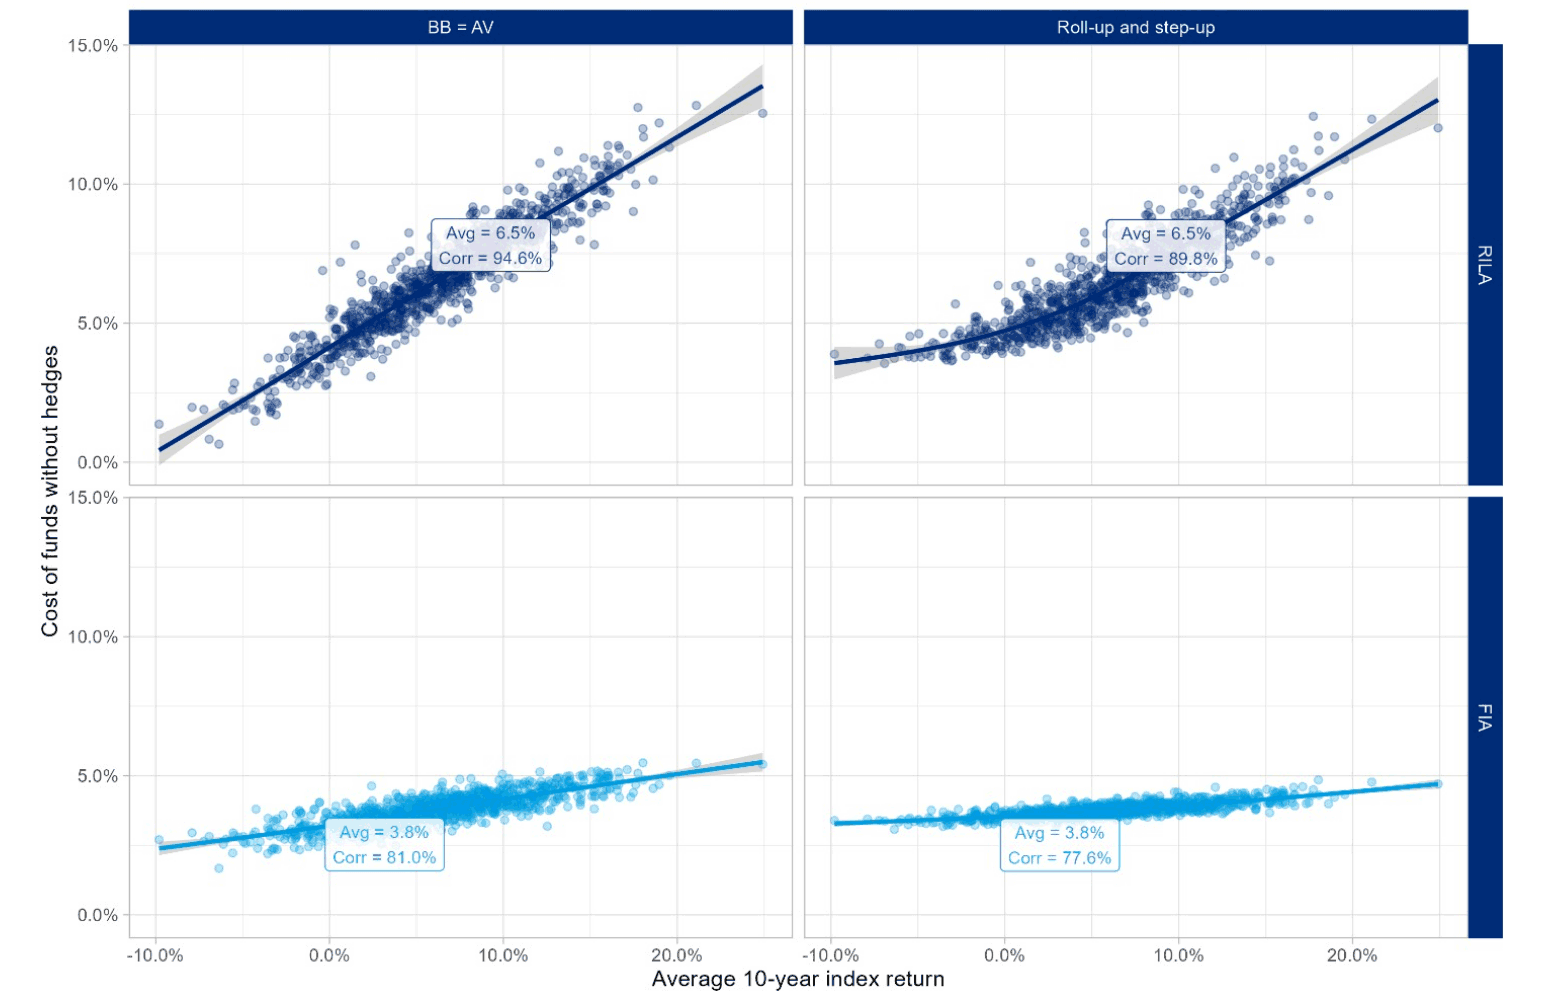
Figure 5 includes hedging 100% of account value. This is a common hedging strategy for indexed products without GLWB. The hedging options are the same basket of call and put options (RILA only) used to hedge index accounts with a cap.
Figure 5
Cost of funds versus index performance: 100% of account value hedge
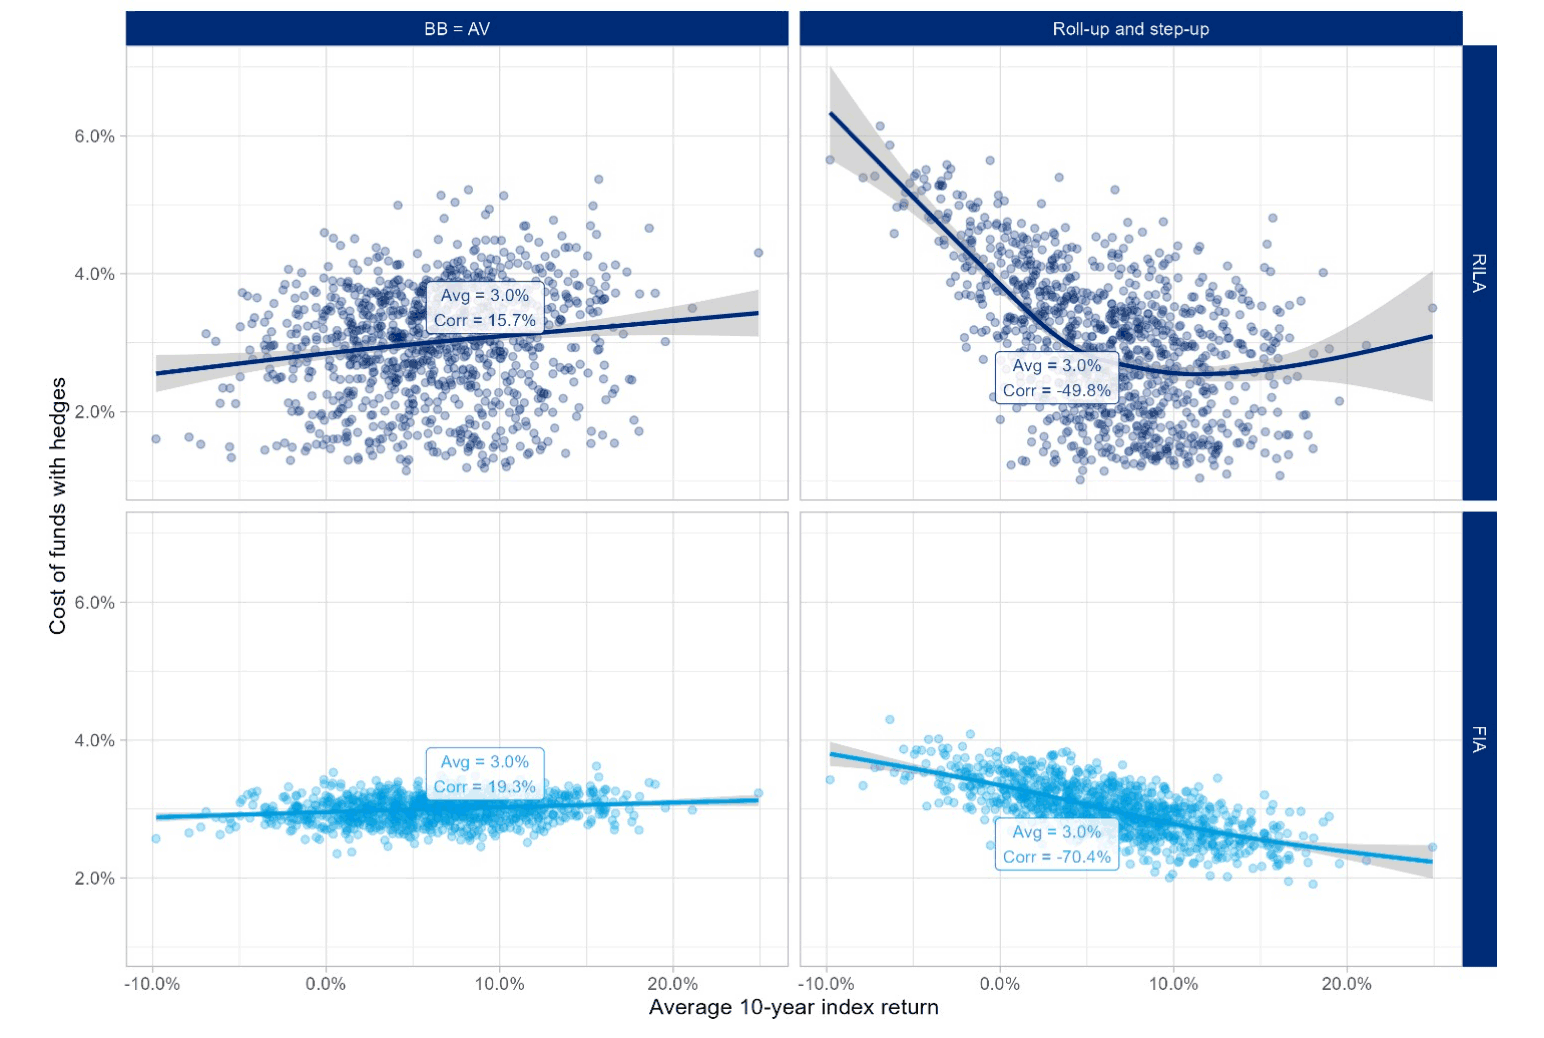
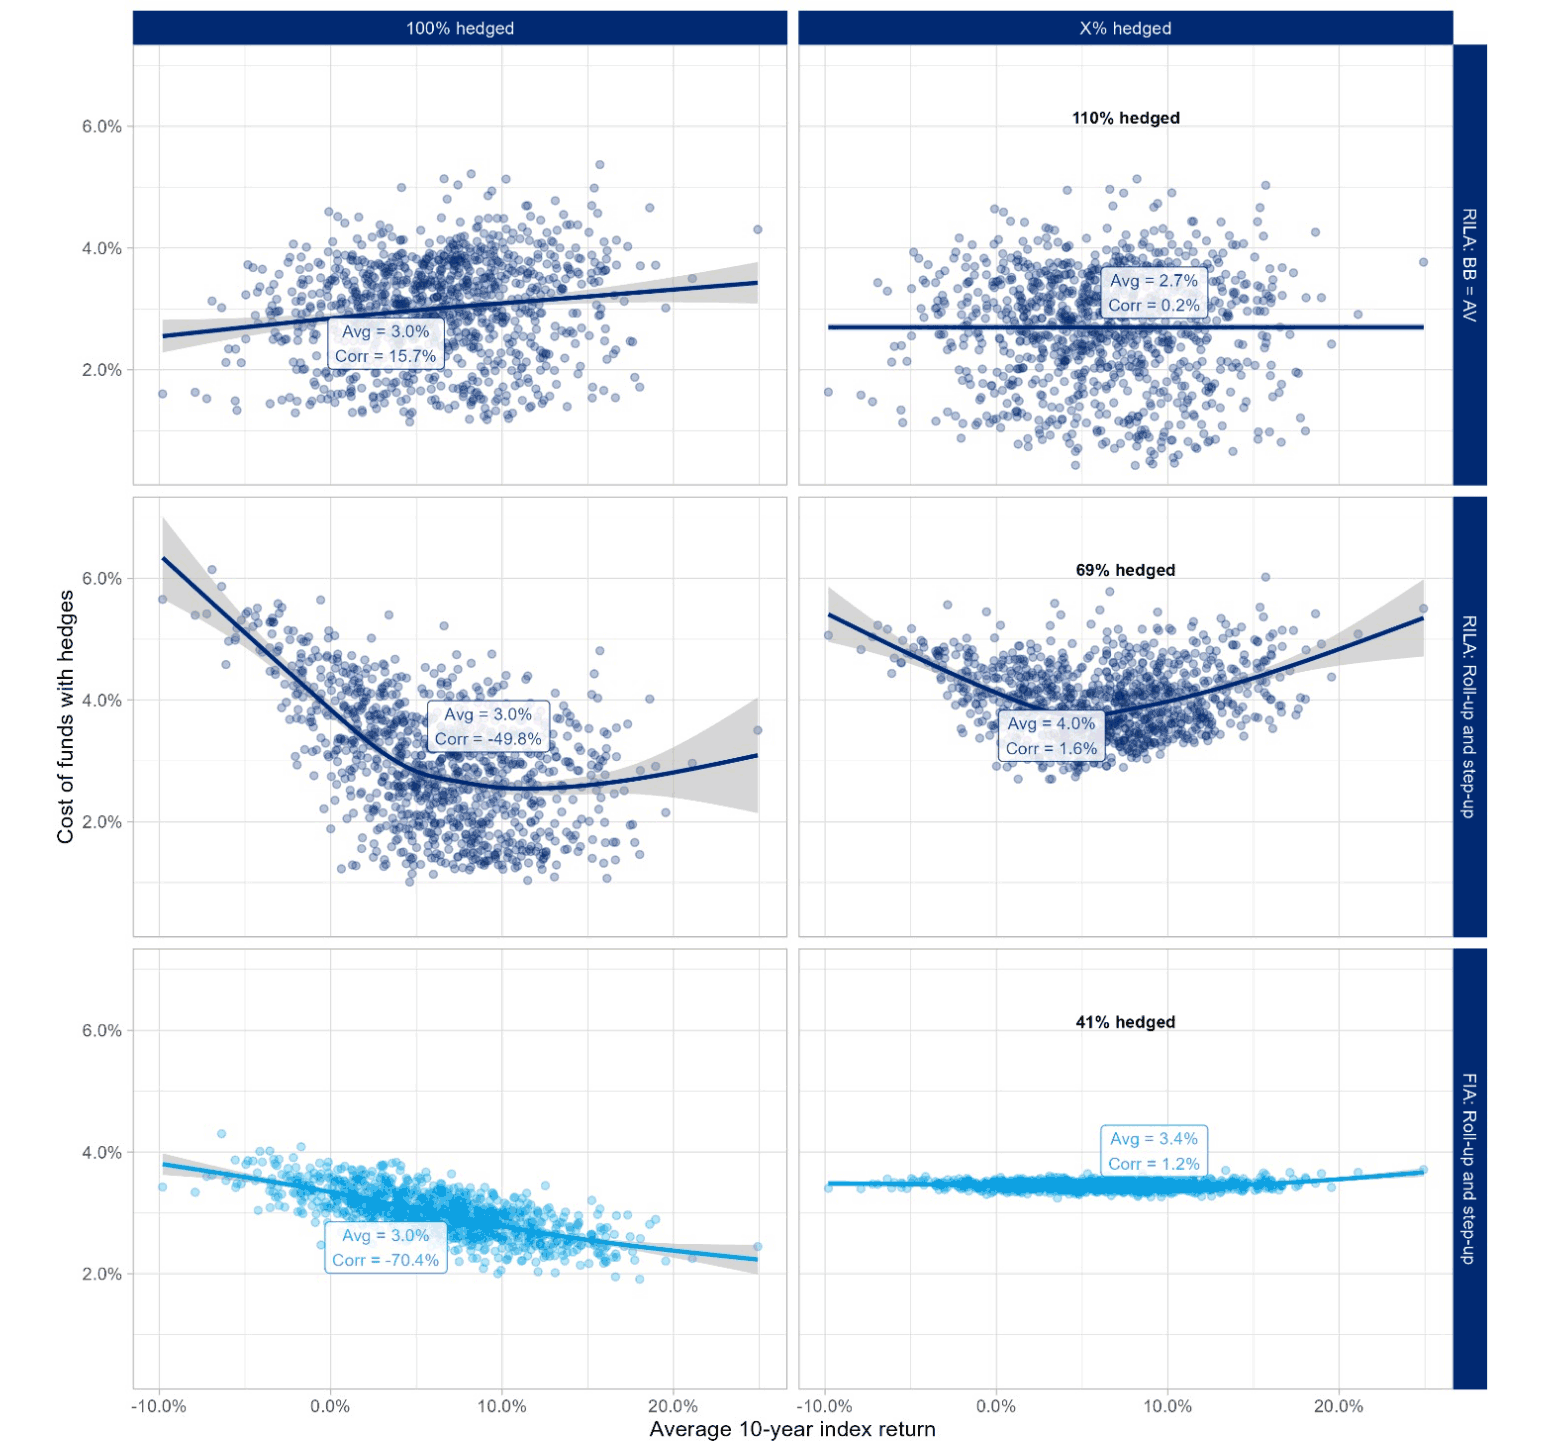
Figure 6 shows the impact of adjusting the hedging strategy to minimize correlation between CoF and index returns. A simplified approach was used with a constant percent of account value hedged. Each product design has its own hedge percentage that was derived to bring correlation close to zero. This simplified strategy is illustrative only. In practice, a hedging strategy would be much more rigorous with ongoing monitoring and adjustments required to minimize variance.
Figure 6
Constant percentage of index credits is hedged to reduce market sensitivity
Conclusion
RILA products have enjoyed tremendous sales growth up until the rising interest rate environment of the past year. This growth included the launch of GLWB riders. When carriers first introduced GLWBs, income benefits had a strong link to account value performance. This had the advantage of closely aligning the index account hedging strategy with the future guaranteed income stream. In 2021 carriers added guaranteed roll-ups which increased both downside protection for the customer and risk for the insurer, requiring a more robust approach to risk management.
As innovation continues, pricing actuaries need to consider how GLWB riders interact with index credits and market risk ramifications. Risk mitigation strategies should be customized accordingly and reflected in pricing and product designs.
Statements of fact and opinions expressed herein are those of the individual authors and are not necessarily those of the Society of Actuaries, the editors, or the respective authors’ employers.
Matt Heaphy, FSA, MAAA, is a manager with the Actuarial Practice of Oliver Wyman. He can be reached at matt.heaphy@oliverwyman.com.
Nicholas Carbo, FSA, MAAA, is a senior principal with the Actuarial Practice of Oliver Wyman. He can be reached at nicholas.carbo@oliverwyman.com.
David Elliott, FSA, CERA, MAAA, is a senior manager with the Actuarial Practice of Oliver Wyman. He can be reached at david.elliott@oliverwyman.com.