
SOA Accelerated Underwriting Practices Survey
By Al Klein
Product Matters!, May 2024

The Product Development Section sponsored research to examine company accelerated underwriting practices. Milliman was engaged to perform the study and in 2022 conducted two Accelerated Underwriting (AU) surveys, one of direct companies and another of reinsurers. Twenty-four direct companies and seven reinsurers responded to the two surveys.
These surveys were a follow up to an AU survey completed in 2019. The current survey asked for actual results from 2019–2021 and expected results from 2022. The 2019 survey collected results from 2017 and 2018.
Note that for the rest of this article, unless otherwise specifically mentioned, “Survey” will be referring to the 2022 Survey. This article will provide some of the highlights of the direct company and reinsurer surveys.
One of the goals of the Survey was to determine how COVID-19 impacted AU programs. Twenty-two direct companies indicated that they made changes to their AU program between 2020 and 2022, with over one-third of these companies indicating they modified their AU programs for COVID-19. Six of the seven reinsurers indicated they thought about half or most of the growth in 2020 and 2021 was due to COVID-19, while one reinsurer thought only a little of the growth was due to COVID-19.
The top 5 types of changes to AU programs among the 22 responding direct companies from 2020 to 2022 were to:
- Face amount limits: Seventeen indicated making face amount changes. Eight of the respondents made the change because of COVID-19. Twelve of the respondents indicated the change was less restrictive, i.e., an increase in face amount limit levels.
- Algorithm: Nine respondents changed their AU algorithm, with 6 respondents indicating making a modification to the algorithm and 4 indicating the change was less restrictive.
- Data sources: Nine respondents changed their data sources with 7 of these respondents indicating the change was a new data source.
- Issue age limits: Seven of the respondents changed their issue age limits with 6 of these respondents indicating the change was less restrictive.
- Random holdouts: Seven of the respondents changed their random holdout practice with 5 of these indicating the change was less restrictive.
Twenty-nine percent of the respondents indicated they saw demographic changes in their business with the introduction of AU programs. There were limited responses to the type of changes, but the two most common were age and face amount of coverage applied for.
Compared to the 2019 Survey, the most common issue age and face amount levels remained the same, as follows:
- Minimum issue age: 18
- Maximum issue age: 60
- Minimum face amount: $100,000
- Maximum face amount: $1,000,000
That said, there was an expansion of the averages, i.e., larger average maximums and lower average minimums, with one exception (the minimum face amount, where there was an increase). Compared to the 2019 Survey, the average:
- Minimum issue age: Decreased from 20 to 16
- Maximum issue age: Increased from 55 to 59
- Minimum face amount: Increased from $53,000 to $79,000
- Maximum face amount: Increased from $800,000 to $2,100,000
Figure 1 shows the distribution of the maximum issue age and face amount limits among the 24 companies. The two most common maximums were:
- Issue age 60 and face amount $3,000,000 (6 companies)
- Issue age 50 and face amount $1,000,000 (4 companies)
Figure 1
Maximum Issue Age and Face Amount Limits in 2022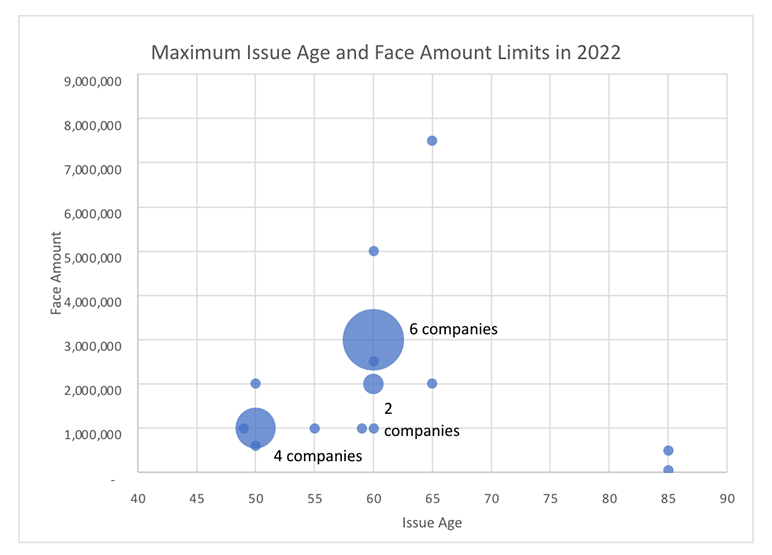
The five tools most commonly used for waiving fluid tests and/or the medical exam were:
- Electronic application (92% of respondents)
- Prescription histories and Medical Information Bureau (MIB) data (88%)
- Motor Vehicle Record (MVR) data (79%)
- Application/tele-underwriting interview (71%)
The five tools most commonly used for determining the risk class were the same, but in a different rank order:
- Electronic application and MVR data (92%)
- Prescription histories (88%)
- Application/tele-underwriting interview (71%)
- MIB data (67%)
Less than two-thirds of the companies indicated they conduct post-issue audits, with the primary reason for conducting them being to determine cases with misrepresentation or fraud. The primary tool used for conducting post-issue audits was an attending physician statement (APS) (80% of the respondents), but many other tools were also used by the companies.
Of the companies doing random holdouts, the highest percentage of holdouts ranged from 55% in 2020 to 10% in 2021, with 2019 being close to the 2020 result and 2022 being close to the 2021 result. It makes sense that there has been a drop in the percentage of random holdouts, as companies become more comfortable with their findings.
It is likely that the percentage of random holdouts will continue to drop in the future, with a possible increase in post-issue audits, as this is less intrusive to the applicant.
Of all AU eligible policies, the average percentage expected to have their fluid tests and/or paramedical exams waived in 2022 was 46%, with a range among the respondents of 13% to 100%.
The average not taken and withdrawal rates on AU polices were slightly lower than on fully underwritten policies:
- The average not taken rate on AU was 5% to 6% vs. 6% to 7% on fully underwritten policies.
- The average withdrawal rate on AU was 13% vs. 15% on fully underwritten policies.
Fifty-four percent of the respondents indicated they had a hybrid AU program on their most prevalent AU program. Based on the comments provided, a hybrid program can be described as the use of Electronic Health Records (EHR) or APS plus underwriter judgement to determine if the applicant can be issued a policy on a fluidless basis. I expect hybrid programs like these as well as new approaches to become more common in the future, especially as new data sources become available.
One of the biggest areas of interest for actuaries and others is what kind of mortality slippage, i.e., mortality in excess of fully underwritten experience, to expect. We tried to address this in the report in five ways:
- Direct company comparison of expected mortality for AU eligible policies that had the underwriting requirements waived to expected mortality for fully underwritten policies. Multiple ranges were provided, from < 90% to > 125%. While results were also split by age, the focus here is on the overall results.
- Direct company random holdout positive and negative findings. We asked the companies to provide the percentage of all business that each finding represented and to make sure that the percentages provided added up to 100%. We then assigned an expected mortality level for each of the findings and multiplied this expected mortality level by percentage given for that finding to determine the overall expected mortality/slippage. The findings requested were:
- Better risk class
- As expected
- Worse by up to two risk classes or two table ratings
- Worse by more than two risk classes (excluding smoker misrepresentation) or more than two table ratings
- Smoker misrepresentation
- Decline/postpone
- Direct company post-issue audit positive and negative findings, as described above
- Reinsurer’s expected range of AU mortality over fully underwritten mortality for the lowest mortality clients
- Reinsurer’s expected range of AU mortality over fully underwritten mortality for the highest mortality clients
While this information was provided for multiple years, we used 2022, the most recent year, for our estimations. Our goal was to determine the range of possible mortality slippage. The findings are shown in Table 1 below.
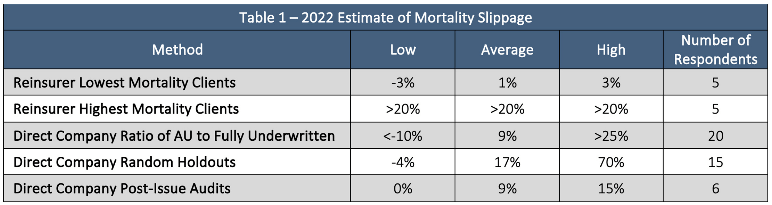
The range of results is quite wide between the low and the high and for each of the methodologies. On the low end, there were some negative results, implying AU mortality better than that on fully underwritten business. In talking to some companies (outside of the survey), a few believe they can achieve mortality levels on their AU programs better than on fully underwritten. While I believe in certain circumstances this could be achieved, it would currently be rare. But in the future with new and emerging data sources, I believe this would possibly be more likely to be achieved.
The high end included results of over 25% and 70%. The reason for the 70% was one company indicated a high level of declines/postpones. While over one table rating (25%) is certainly possible, I think the slippage of 1% to 17%, as shown in the average, is probably the range most companies would experience today. That said, actual results can vary considerably between companies because of the following:
- Company practices, e.g., algorithm, random holdouts, post-issue audits, risk mitigation
- Data sources used
- Target market
- Distribution channel
The survey included several opinion questions and I will end this article with findings from these questions. Where the same question was also asked in the reinsurer survey, I will provide both sets of results. Each of these questions asked the company/reinsurer to provide their top 5 choices. The rank was determined by multiplying the number of respondents providing rank 1 by 5, rank 2 by 4, etc.
The first opinion question was to provide the top 5 biggest challenges to designing and developing AU programs. The results are shown below in Table 2.
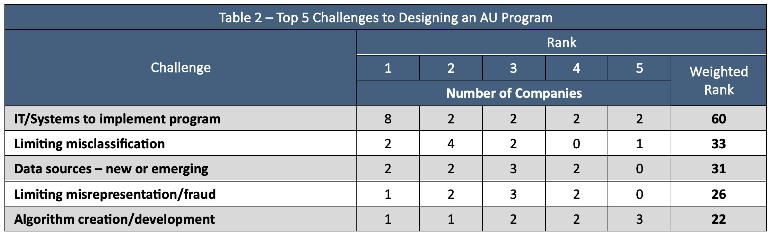
IT challenges was the top choice by almost double the weighted rank of the next challenge. Limiting misclassification, data sources, limiting misrepresentation/fraud, and the algorithm creation/development were also in the top 5.
The next opinion question was to provide the top 5 data sources that best assess mortality for AU programs. Table 3 shows the results.
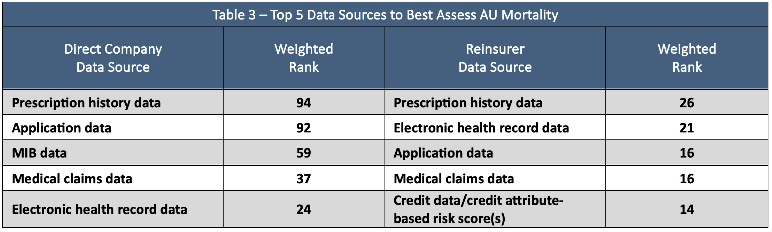
The top two answers for the direct companies, prescription history data and application data, were indicated as being much more important than the other three, MIB data, medical claims data, and EHR data. For the reinsurers, the top 5 answers did not have as much variance because there were less reinsurers than direct companies responding. The top two answers for the reinsurers were prescription histories and electronic health record data. There was one unique answer in both lists, MIB data for the direct companies and credit data/credit attribute-based risk scores for the reinsurers.
The next question was on the top 5 tools to mitigate fraudulent practices in AU programs. This question was also asked of both the direct companies and reinsurers, and the results are shown in Table 4 below.
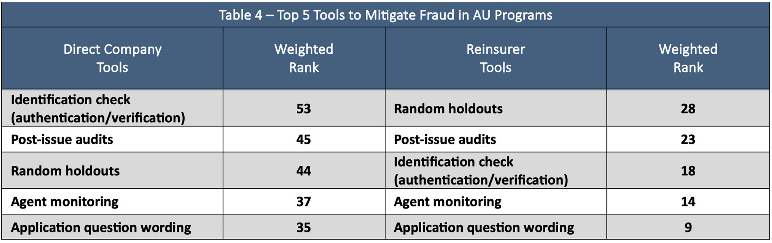
The top 5 tools were the same for both the direct companies and reinsurers, except the first and third choices were flip-flopped between the two, with identification check (authentication/verification) being first for the direct companies and random holdouts being first for the reinsurers. Agent monitoring and application question wording were the 4th and 5th selections for both.
The last opinion question was on the top 5 drivers for the best design, implementation, and overall success of an AU program. The top 10 responses to this question are show in Table 5.
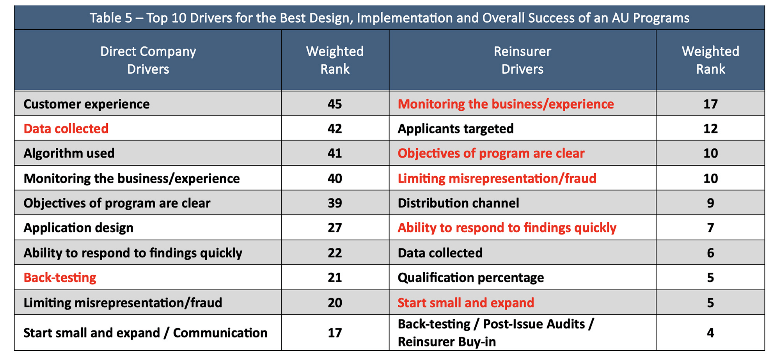
Interestingly, seven of the top 10 drivers were the same between the direct companies and reinsurers. These are highlighted in red where the direct company or reinsurer had the higher rank for the driver.
The top 5 among those chosen by both the reinsurers and direct companies were:
- Monitoring the business/experience
- Data collected
- Objectives of the program are clear
- Limiting misrepresentation/fraud
- Ability to respond to findings quickly
Among the differences, I found it interesting, and good, that the top answer and focus for the direct companies was customer experience. The third driver for the direct companies was the algorithm used, which also makes sense that it is important to the direct companies.
The second ranked driver for the reinsurers was applicants targeted; this provides an insight which is important and often overlooked. The 5th ranked driver for the reinsurers was distribution channel, which is also sometimes overlooked as an important consideration. The only other difference I will mention is ranked 10 by the reinsurers and not by the direct companies, is reinsurer buy-in! That was ranked 13th by the direct companies so it didn’t make my top 10 cut.
If interested in AU, I encourage you to review the full report. There is much more in the report than I was able to cover in this article and while the report is long, there is a section towards the beginning on how to best navigate through it.
I would like to thank the SOA and the Product Development Section for the opportunity to provide you with this research. If you have any questions on this article or AU in general, please contact me.
Statements of fact and opinions expressed herein are those of the individual authors and are not necessarily those of the Society of Actuaries, the editors, or the respective authors’ employers.
Al Klein, FSA, MAAA, is a principal and consulting actuary at Milliman, Inc. He can be reached at al.klein@milliman.com.