
SOA Accelerated Underwriting Reinsurer Practices Survey
By Al Klein
Reinsurance News, February 2024

The Reinsurance Section initiated research to examine company accelerated underwriting (AU) practices. Milliman was engaged to perform the study and in 2022 conducted two AU surveys, one of direct companies and another of reinsurers. This article will focus on the results from the Reinsurer Survey. The Reinsurer Survey was much shorter, consisting of six questions. Seven reinsurers responded to the survey.
The survey asked for actual results for 2019–2021 and expected results for 2022.
By face amount, the percentage of new life insurance business assumed by reinsurers under AU programs ranged from less than 1% in 2019 to 35% in 2022. The average percentages among the reinsurers increased from 6% in 2019 to 15% in 2022. Six of the seven reinsurers indicated they thought about half of the growth in 2020 and 2021 was due to COVID-19.
Three of the questions were related to opinions.
The top five sources of data that reinsurers believed provided the best assessment of mortality for an AU program, in rank order, were:
- Prescription history data,
- electronic health record data,
- application data,
- medical claims data (tie with application data), and
- credit data/credit attribute-based risk score(s).
The top five tools that best mitigate AU fraudulent practices, in rank order, were:
- Random holdouts,
- post-issue audits,
- identification check (authentication/verification),
- agent monitoring, and
- application question wording.
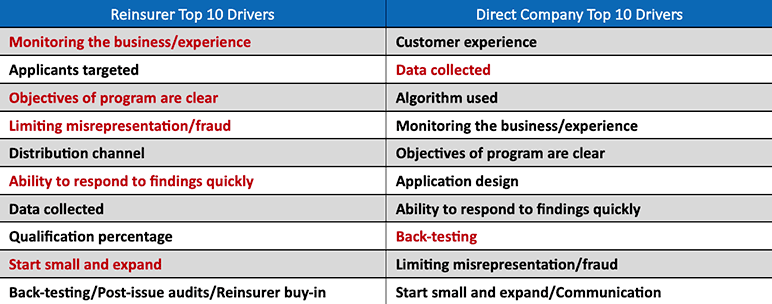
The third opinion question was on the top five drivers for the best design, implementation, and overall success of an AU program. It is interesting to compare these results to those from the same question of the direct companies. The top 10 drivers are shown in Table 1 below. Note that seven of the top 10 were the same drivers; these are highlighted in red in the column where they were ranked higher.
The top five among those chosen by both the reinsurers and direct companies were:
- Monitoring the business/experience,
- data collected,
- objectives of the program are clear,
- limiting misrepresentation/fraud, and
- ability to respond to findings quickly.
Among the differences, I found it interesting, and good, that the top answer and focus for the direct companies was customer experience. The third driver for the direct companies was the algorithm used, which also makes sense that it is important to the direct companies. The second ranked driver for the reinsurers was applicants targeted; this provides an insight that is important and often overlooked. The only other difference I will mention is ranked 10 by the reinsurers, which is reinsurer buy-in. In my opinion, the reinsurers have some work to do here!
Table 1
Top Drivers for the Best Design, Implementation, and Overall Success of an AU Program
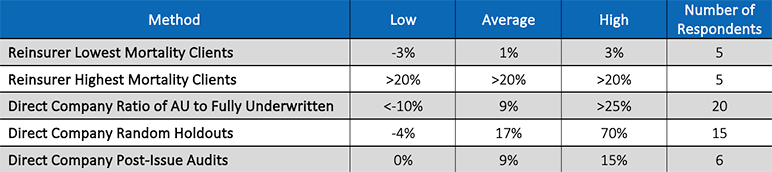
The last topic I will cover in this article is of interest to most studying AU, i.e., mortality slippage. In the Reinsurer Survey, we asked the reinsurers to indicate the range of mortality on AU business over fully underwritten business for their lowest and highest mortality clients.
Several approaches were taken in the Direct Company Survey to also estimate mortality slippage. The approaches were:
- Ratio of AU mortality experience to fully underwritten mortality experience,
- estimated percentages of better and worse mortality findings on random holdouts, and
- estimated percentages of better and worse mortality findings on post-issue audits.
We explored the results by year and age, but I will only discuss the overall results for 2022 here. As shown in Table 2, the findings between the five approaches are quite wide. Likely reasons for these differences include:
- Company practices, e.g., algorithm, random holdouts, post-issue audits, risk mitigation;
- data sources used;
- target market; and
- distribution channel.
Table 2
2022 Estimates of Mortality Slippage
If interested in AU, I encourage you to review the full report (available online). There is much more in the report than I was able to cover in this article. The report is long, but there is a section toward the beginning on how to best navigate through the report.
I would like to thank the SOA and the Reinsurance Section for the opportunity to provide you with this research.
Statements of fact and opinions expressed herein are those of the individual authors and are not necessarily those of the Society of Actuaries, the newsletter editors, or the respective authors’ employers.
Al Klein, FSA, MAAA, principal and consulting actuary, Milliman. If you have any questions on this article or AU in general, please contact me at my email address: al.klein@milliman.com.