
Optimizing QDIAs for Retirement
By Paul J. Donahue
Retirement Section News, June 2022

Qualified Default Investment Alternatives (QDIAs), especially target date funds (TDFs), increasingly dominate the defined contribution (DC) plan universe. According to Vanguard’s 2021 “How America Saves” study, 37 percent of plan assets were in TDFs in 2020, and 60 percent of contributions went to TDFs.[1] Optimization of QDIAs for retirement is critically important to create retirement income security for American retirees.
Investment horizon is perhaps the most critical determinant of an asset allocation strategy.[2] The asset allocations of the TDFs currently in market vary widely.[3] The asset allocation decisions of existing target date funds appear to reflect a universal, unstated assumption that plan participants will spend down their DC plan balances over their remaining lifetimes. However, the data we will discuss below demonstrates that retiree investment horizons are, in practice, generally longer than their remaining lifetimes. The consensus TDF allocation to equity is too low to be appropriate for the median participant’s investment horizon.
In this article, I will examine the implications for an ERISA fiduciary in the construction and selection of the plan’s QDIA, with particular emphasis on the in- and near-retirement vintages of TDFs, by far the most prevalent form of QDIA. The chief thesis of the article is that participant investment horizons are much longer than implicitly assumed in TDF asset allocations. Participants would benefit from a materially greater allocation to equity in the retirement vintages of TDFs and probably along the entire glidepath.
Plan Design and Option Selection/Construction Should be Grounded in the Realities of Participant Behavior
Most Retirees Preserve Assets
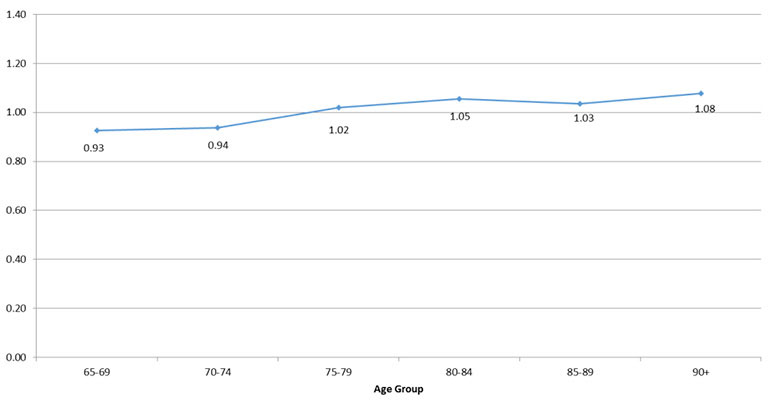
The evidence is compelling that people of all ages spend no more than their recurring income. The chart below is taken from the ERBI Issue Brief “Asset Decumulation or Asset Preservation: What Guides Retirement Spending?”[4] (See Figure 1)
Figure 1
Median Ratio of Household Spending to Household Income From 2001–2013, by Age Group
The EBRI Issue Brief also studied the decumulation of non-household assets. I summarize the results in Table 1 below.
Table 1
Percentage Change in Assets in First 18 years of Retirement[5]
| High Asset Group: ≥ $500,000 | -11.8% |
| Middle Asset Group: $200,000 - $500,000 | -27.2% |
| Low Asset Group: < $200,000 | -24.4% |
Additionally, the EBRI study states: “Having guaranteed income for life, such as a pension, doesn’t make retirees more likely to spend down their assets either. To the contrary, of all the subgroups studied, pensioners have the lowest asset spend-down rates. … When household income of retirees is compared to household spending, the study finds that the majority of households indeed limit their spending to their income.”[6]
The Dispersion of Cumulative Asset Decumulation is Great
Figure 2 from EBRI Asset Decumulation shows that there is wide variation in the extent of asset decumulation/preservation.
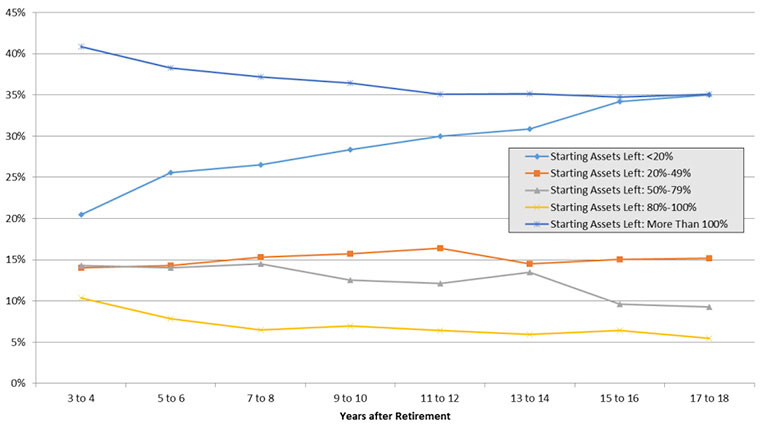
The EBRI study summarizes the results:
Figure 2 shows the percentage of retirees in Group A that had a given proportion of their starting assets (assets in the first two years of retirement) left at different points in retirement. By the third to fourth year of retirement one-in-five retirees in this group had less than 20 percent of their starting assets left. By the 17th–18th year of retirement, more than one-in-three (35.1 percent) retirees in this group had less than 20 percent of their starting assets left. Given that the starting assets of this group were very low (median of $31,740), this means a significant number of retirees (Group A constitutes about two-thirds of the entire sample) had very few assets left by the 17th–18th year of their retirement. On the other hand, by the end of the 17th–18th year, 35.1 percent of retirees in this group had more than 100 percent of their starting assets left. That means more than one-in-three retirees in this group had grown their assets throughout the first two decades of their retirement. This is in sharp contrast with the predictions of models used to measure retirement security.[7]
Additional Evidence About Decumulation of Tax-Advantaged Assets
According to Vanguard’s report, “Retirement Distribution Decisions among DC Participants,”[8]: Nearly three quarters of DC plan assets at retirement eventually migrate to IRAs. According to Investment Company Institute Data quoted by Vanguard: “In 2016, 22 percent of IRA-owning individuals age 60 to 69 took a withdrawal and 79 percent of individuals age 70 or older took a withdrawal. The Institute also reported that 58 percent of individuals age 70 or older based the withdrawal amount on the RMD rules.”[9]
Conclusions
The evidence is very strong that the majority of participants take only the required minimum distributions (RMDs) from their tax-advantaged assets once they reach the age when they are required. However, participants overall withdraw more before required minimum distributions begin than afterward, and 20 percent of participants with low initial asset balances had 20 percent or less of their initial balances after three years.[10]
Factors Critical to QDIA Construction/Selection Will Vary Widely by Plan
The data above suggests that consensus views about the investment horizons of retirees are understating them, but also that there is considerable variation among retirees about investment horizon. The data suggests, though more research/evidence is required, that bridging the gap to delayed receipt of Social Security may be a significant use of retirement financial assets. I discuss using DC assets to bridge the gap to Social Security further below. In any case, it seems clear that a plan fiduciary needs to evaluate the behaviors of the plan’s participants as best the fiduciary can before it can prudently choose a TDF vintage with investment allocations appropriate for the plan’s retired participants.
Participant Behavior Variables That Must be Considered
That retirees actually preserve assets runs against the universal perception that retirement savings are inadequate. How retirees manage on their income alone is important data for plan sponsors in designing or selecting their TDF or other QDIA. I list below what I consider to be the most important factors.
Continuing Employment
I consider the single most important variable in determining an appropriate asset allocation for the retirement vintage of a plan’s QDIA to be continued participant employment. Participants who are above the age for required minimum distributions but still employed with the plan sponsor, and therefore exempt from otherwise required distributions from their current employer’s plan,[11] seem unlikely candidates to do more than take minimum distributions when they do retire. They will have worked beyond the other side of the bridge to Social Security.
For terminated vested participants, the plan’s record keeper will have data about their withdrawals from the plan. Participants who have not taken any withdrawals before attaining the age for required minimum distributions seem unlikely candidates to take more than the required minimum distributions when they reach that age. For younger participants, the employer might survey participants about their expectations, or rely on general survey data like that discussed above.
Bridging the Gap between Retirement and Commencement of Social Security Benefits
Record numbers of Americans are voluntarily leaving their jobs. In September, 4.4 million left their jobs voluntarily, a record, following 4.3 million in August. Goldman Sachs estimated that two-thirds of those voluntarily leaving the work force during the pandemic were over age 55 and that many had retired and were unlikely to return to the work force.[12]
According to an analysis by the Washington Post, many of those retiring were postponing commencement of their Social Security benefit so as to receive a higher benefit when they did start receiving Social Security. During the period January through September 2021, retirements were up 5 percent compared to the corresponding period in 2020, but election of Social Security was down 5 percent, the greatest decline in more than two decades.[13] This suggests that many retirees are using the drawdown of other assets, including DC plan assets, to bridge the gap to Social Security. Growth in the use of DC assets to bridge the gap between retirement and Social Security might significantly shorten the median retiree’s investment horizon compared to that discussed above. The apparent increase in the use of the bridge strategy, which enjoys almost complete support among retirement experts for those of average or better health, is a factor plan sponsors should take into account designing the retirement vintage of their QDIA. The larger the use of the bridge strategy, the more important that the retirement vintage QDIA manage the sequence of return risk.
Defined Benefit Pension Plans and Other Post-Retirement Benefits
The second major factor is the continued persistence, albeit at a greatly reduced level, of retirees with defined benefit pension plan coverage at retirement. According to EBRI, in 2017, approximately 10 percent of private sector workers had access both to a defined benefit plan and to a defined contribution plan.[14] Public sector employee access to defined benefit plans is much higher.[15] A defined benefit pension is a fixed income investment equivalent. Employees with both a meaningful Social Security benefit and a defined pension plan annuity benefit need a much lower, if any, fixed income allocation in their DC plan assets. Additionally, the EBRI study showed that participants with a defined benefit pension do in fact draw down assets more slowly than those without a defined benefit pension annuity.[16]
The availability of other post-retirement benefits, above all post-retirement medical coverage, but to a lesser extent post-retirement life insurance, will also affect participants’ investment horizons and the appropriate near- and in-retirement QDIA/TDF glidepath allocations.
Public Assistance
Public assistance provides a larger role in providing income to retirees than most realize. Four percent of retirees with retirement asset accumulations receive public assistance, and 35 percent of those without retirement asset accumulations receive public assistance.[17] These figures significantly understate the importance of government subsidies to retirement income security. According to the Congressional Research Service, eliminating housing subsidies would increase poverty among the elderly by 1.1 percent.[18] Additionally, the elderly poverty statistics do not account for the government subsidies to the 1.2 million elderly in nursing homes. A significant number of these nursing home residents receive support from Medicaid. Medicaid covers 60 percent of nursing home residents, at a cost in 2015 of $55 billion.[19] Increased income from retirement plans would benefit all taxpayers, including benefit plan sponsors, by reducing the reliance of retirees on government subsidies.
Employer Objectives
Employer plan objectives and plan design are important factors that affect the investment horizons available to participants in the plan and for that reason the optimal QDIA/TDF retirement vintage’s construction. Does the plan sponsor want to retain retiree DC assets in the plan? Presumably, a design that optimizes the TDF for retirement is more important when a plan sponsor actually intends that the plan’s retirees continue to invest in the TDF in retirement.
I make the following generalizations based on the data above, which I believe are valid regardless of the individual retiree withdrawal patterns. Optimizing plan design for retirees means making automatic payments of required minimum distributions available and permitting ad hoc withdrawals. Even with an earnings assumption far below historical norms, a participant with an RMD strategy will not exhaust the participant’s balance at the time RMDs begin. The key point here is that for individuals who only take minimum distributions, the allocations to higher return equity assets by the consensus off-the-shelf target date funds is far too low. The asset allocation of the retirement vintage of a TDF fund should be fit to the actual withdrawal patterns of the plan’s retirees. This will almost universally require substantially increasing the allocation to equity, something that may be available only in a custom target date fund.
We noted above that there is some evidence that draw down of financial assets is used by some participants to finance delaying receipt of Social Security benefits. In addition to accommodating the very prevalent minimum distribution withdrawal strategy, plan design and QDIA/TDF asset allocations should support allowing participants to postpone commencement of their Social Security benefits to age 70. This retirement income strategy has strong support in academic discussions of how to optimize retirement income.[20] For a participant aged 65 adopting this strategy, the balance available at retirement and the sequence of returns for the first five years are important.[21] A prudent plan design will take at least these two withdrawal patterns into account, and possibly others, based on the sponsor’s participants’ actual use of their DC assets.
Fiduciary Considerations
In “Target Date Retirement Funds—Tips for ERISA Plan Fiduciaries,” the U.S. Department of Labor gives plan fiduciaries the following recommendation: “Inquire about whether a custom or non-proprietary fund would be a better fit for your plan.”[22] A large plan sponsor is opening the door to an allegation that the sponsor’s participants would have been better off in a custom target date fund if the sponsor has not considered a custom target date fund. Clearly, the discussion above about actual participant use of their DC assets provides strong support for the construction of a custom target date fund by major plan sponsors.
Given the increasing dominance of target date funds in the DC space, it is natural to suppose that the plaintiffs’ bar will increasingly look to them as litigation targets. Every major plan sponsor should at least have evaluated the potential appropriateness of a custom target date fund applying accepted principles of quantitative finance and have documented its conclusions as a basic matter of ERISA procedural prudence. Adoption of appropriate due diligence procedures and documentation that the procedures were followed should protect plan sponsors against ERISA litigation. Those procedures should include evaluation of a custom target date fund. Finally, to the extent that appropriate due diligence leads to selection of existing plan options as components of the custom target date fund’s glidepath, ongoing fiduciary monitoring costs will be reduced.
Investment Considerations
As we noted above, asset allocation is the most significant determinant of return and risk, and asset allocation is the feature that analysis of the plan’s benefit structure and participant demographics should determine. Once an appropriate asset allocation has been selected, custom target date funds allow the choice of components that will optimize the fund’s risk return profile. Fees will always be a critical consideration, because it is only returns net of fees that matter to participants. The use of existing plan options in constructing the glidepath, or the replacement of existing plan options by the components chosen for the glidepath, would appear to offer the greatest potential to reduce fees because of enhanced bargaining power and economies of scale, and to maximize participant welfare, both for participants invested in the custom TDF and for other participants as well. Generally speaking, the choice of plan options and target date fund components should itself be regarded as a dynamic optimization exercise. Plan sponsors without internal investment analysis expertise will almost certainly require investment consulting advice to perform this optimization.
An analysis from Alliance Bernstein, “Designing the Future of Target Date Funds,”[23] poses a number of valid questions: “Markets have evolved, has your target date fund?” The Alliance Bernstein answer is no: “Target date market, quick to grow, slow to innovate; Target-date design has not kept pace, failing to reflect best practices adopted by other big pools of assets overseen by fiduciaries, such as pensions and endowments.” The most notable of their suggested TDF omissions are lack of manager diversification and limited use of alternative investment vehicles.[24]
The freedom to choose from a vastly greater universe of possibilities of course increases the complexity and cost of choosing, but will yield better results for participants. Plan sponsors could not prudently let costs lead them to curtail broader due diligence that could improve results for participants, at the very least when the improvement in results offset the costs of due diligence. It seems quite unlikely that a quantitative financial analysis based on plan sponsor demographics, retiree withdrawal patterns and a broad review of available alternatives would find an “off-the-shelf” product best for the sponsor’s participants.
Conclusion
The large and growing importance of QDIAs and especially TDFs to participants’ retirement income security, and the importance of their invested assets to the economy as a whole, as well as plan sponsors’ ERISA fiduciary duties, demand careful and informed TDF construction (or selection) and continuing monitoring of the appropriateness of the TDF’s asset allocation and performance in view of participants’ withdrawal patterns from the plan’s QDIA/TDF. The data suggests that consensus TDF retirement vintages allocations to equity are too low. However, the data also suggests that there is wide dispersion in how retirees use their DC assets. For some plans, the equity allocation might actually be too high, even though for most plans it would be too low. The key point is that plan fiduciaries and their consultants should evaluate how retirees in their plan actually use their DC assets in retirement, and should adjust the return/risk profile of the TDF’s retirement vintage to fit the needs of their own plan’s participants.
Statements of fact and opinions expressed herein are those of the individual authors and are not necessarily those of the Society of Actuaries, the newsletter editors, or the respective authors’ employers.
Paul Donahue, FSA, MAAA, is an actuary in New York City. He is also an attorney and member of the New York bar. He can be reached at pauljdonahuefsa@aol.com.