
Adequacy of Social Security in Meeting Consensus Goals
By Paul Donahue
Retirement Section News, October 2023

Social Security is the program of taxes and benefits created by the Social Security Act of 1935, signed into law by President Franklin D. Roosevelt on Aug. 14, 1935. It was one of the signature and defining achievements of the New Deal. The monthly payments to qualifying older Americans that define the term Social Security for most Americans, and the taxes that are dedicated to their support, are the only parts of the OASDI’s (Old Age, Survivors and Disability Insurance) array of benefits and funding that we will discuss in this essay.
Although as enacted, Social Security contemplated current funding of future benefits,[1] Social Security is almost entirely a program where current benefits are funded by current taxes. In 2022, Social Security taxes[2] amounted to US$993 billion, interest provided US$64 billion, and general tax transfers provided US$183 billion. Benefit payments totaled US$1,088 billion.[3] Considered on its own, the Old Age and Survivors Insurance Trust Fund can pay full benefits only until 2033.[4]
Individual Taxpayer Return on Investment Perspective
We shall have more to say about this later, but the political mantra about Social Security pension benefit recipients: “They earned their benefits!” is largely true. The average historical return on 401(k) participant balances exceeds the rate of return for all current retirees of whatever income level.[5] If participant FICA and SECA contributions had been invested in the average 401(k) portfolio, participants would have had benefits exceeding those provided by Social Security.
Social Security as Social Insurance
The definition of social insurance, included in a presentation by Oliver Wyman for the California Department of Insurance, is a useful point of departure for this article.
Social Insurance: 1. Protection of the individual against economic hazards (such as unemployment, old age, or disability) in which the government participates or enforces the participation of employers and affected individuals; 2. Social insurance encompasses broad-based systems that help workers and their families pool risks to avoid loss due to retirement, death, disability, or unemployment; and to ensure access to health care.[6]
The following description of the characteristics of social insurance found in the Actuarial Standards Board’s Actuarial Standard of Practice No. 32 “Social Insurance” is also useful:
Characteristics of Social Insurance—Three characteristics of social insurance programs are of fundamental importance to the analysis of their actuarial status. First, because participation is essentially mandatory, social insurance programs can be assured of new entrants. Second, because such programs are operated by governments, program termination is usually not an important consideration when determining the program’s actuarial status. Third, social insurance is based on laws and regulations that can be changed (e.g., taxes or premiums may be increased or benefits decreased) without the consent of the participants.[7]
Social insurance programs are an economically efficient means of providing the designed level of protection because:
(1) Standardized, large scale administration provides scale efficiencies, and
(2) the costs of education and promotion are smaller than for private insurance programs.
Appropriate Criterion for Evaluating the Success of Social Security
A person’s evaluation of Social Security’s performance is grounded in what that person thinks Social Security ought to be doing. At one extreme, some believe that Social Security should be doing nothing at all and their proposal for reform is phasing it out.[8]
In this essay, the standard by which I am going to evaluate Social Security is this: Does Social Security provide income sufficient for a person who has worked for many years to have a decent standard of living? I do not make income redistribution a goal in itself,[9] but I do assume that some level of income redistribution is necessary to achieve the “decent standard of living” goal.[10] Also, I do not attempt any economic quantification of “decent standard of living,” but rely on older Americans’ “life satisfaction” to approximate it. My assumption is that those who are satisfied with their quality of life would say they enjoy a decent standard of living.
I realize that my statement of the goal is not particularly well-defined, but in view of the available empirical evidence, I believe that it will do for the purposes of this article.
Social Security and Retiree Income
Social Security provides more than half of income for more than half of the population aged 65 or older. It provides more than 90% of income for one quarter of that population.[11] Current estimates are that 9% of older Americans live in poverty; without Social Security an estimated 38% would live in poverty.[12] Social Security benefits are much lower in the United States than in many other countries in the developed world, at about the 40th percentile (e.g., below Turkey, Estonia and Latvia).[13]
Older Americans’ Life Satisfaction
Péter Hudomiet, Michael D. Hurd and Susann Rohwedder’s important paper “The Age Profile of Life-Satisfaction After Age 65 in the U.S.”[14] provides a wealth of valuable data for those who wish to make policy recommendations about Social Security. The principal point of the study is to explain the counterintuitive result that life satisfaction increases with age beyond retirement into advanced old age, the “paradox of well-being.”[15]
The result I found most relevant for the purpose of this essay is the distribution of average life satisfaction by income quartile. The possible survey responses ranged from 1 (not at all satisfied), 2 (not very satisfied), 3 (somewhat satisfied), 4 (very satisfied) and 5 (completely satisfied). Here are the results:
| Income quartile | Distribution | Average Life Satisfaction |
|---|---|---|
| Lowest | 25.0 | 3.76 |
| 2 | 25.0 | 3.85 |
| 3 | 25.0 | 3.94 |
| Highest | 25.0 | 4.03 |
| All | 100.0 | 3.91 |
The average life satisfaction for the lowest quartile was closer to “very satisfied” than to “somewhat satisfied,” and only 7% lower than that for the highest income quartile. This is consistent with the fact that the lowest income quartile from the preceding section consisted of individuals for whom Social Security provided 90% or more of their total income.
While these data sets equivalences I have implied are by no means conclusive, and while “very satisfied” does not correspond to my “decent standard of living” statement of the goal for Social Security, nevertheless we have come far enough that I am prepared to conclude that the existing Social Security system achieves its social insurance goal.
Funding Challenges
Like a new defined benefit pension plan that provides benefits for prior service, Social Security began with a significant unfunded past service cost, and benefit increases have only made it larger. The Actuarial Note “Unfunded Obligation and Transition Cost for the OASDI Program”[16] points out that in the context of the actual program’s intent and practice, it does not make sense to speak of an “unfunded liability.” However, they do describe a theoretical “transition cost.” In 2004, the “transition cost” was 13 trillion dollars, and is about 50% higher now.[17]
Rate of Return Evaluation of Social Security Taxes and Benefits
The chart below, taken from “Cohort-Specific Measures of Lifetime Social Security Taxes and Benefits,”[18] explains why making the case for cutting benefits is very difficult politically.
OASI Chart
OASI Real Internal Rate of Return, Expressed as a Percent, by Policy and Cohort
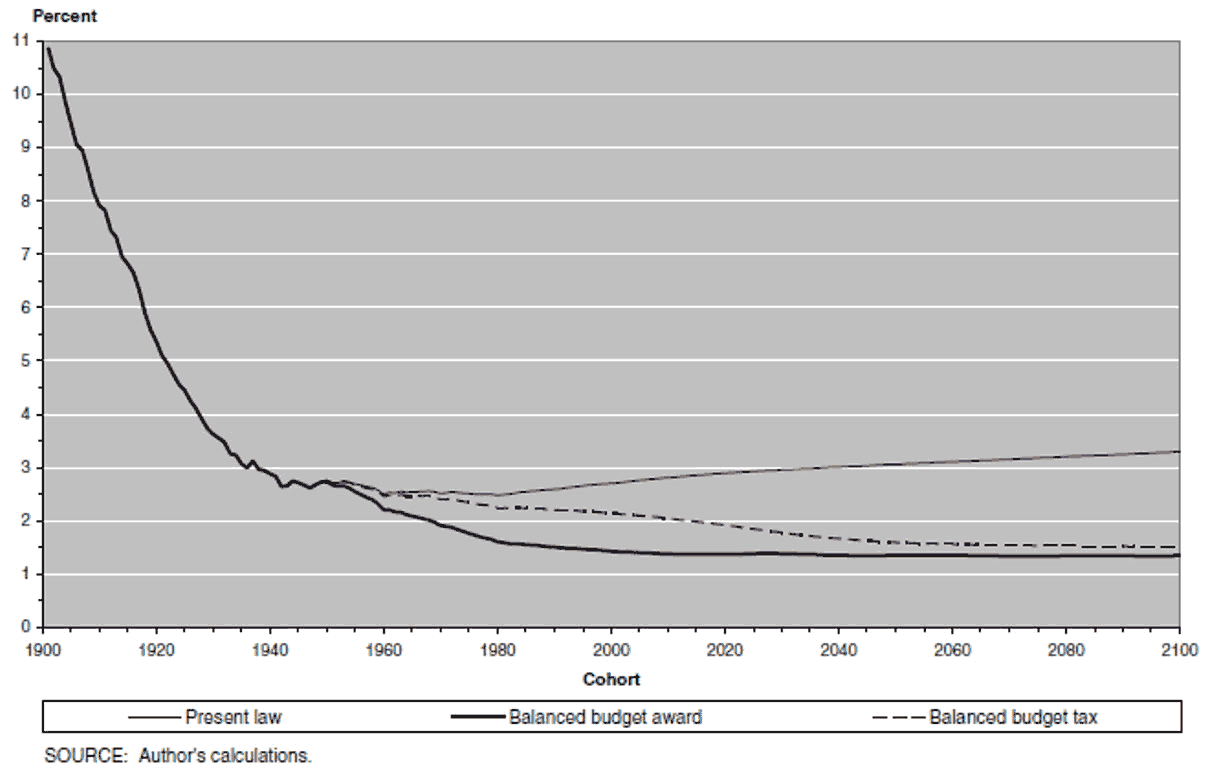
Under any plausible scenario for adjustment of taxes and/or benefits needed to sustain Social Security, the rate of return on contributors’ taxes is relatively low, far below the long-term rate of return on equity, 5.86%.[19] Yet, Social Security has reduced the poverty level among the elderly by 27%.
The political obstacles to cutting benefits posed by the mantra “they earned their benefits” reinforces my belief that cutting benefits is not the right solution to the Social Security funding challenge.
Progressivity of the Current System
The internal rate of return analysis can be extended to analyze return by discrete levels of taxes paid and benefits received. The purely illustrative Chart 1 below tracks cumulative benefits paid (y-axis) and cumulative taxes paid (x-axis).[20] As a specific example, those who have paid the first 40% of Social Security taxes, who receive under a progressive tax regime (red line) 60% of the benefits paid, under a neutral regime (dotted line) 40% of the benefits paid, and under a regressive regime (blue line) 15% of the benefits paid.
Chart 1
Progressivity of Social Security: Illustrative Examples Using Stylized Lorenz Curves
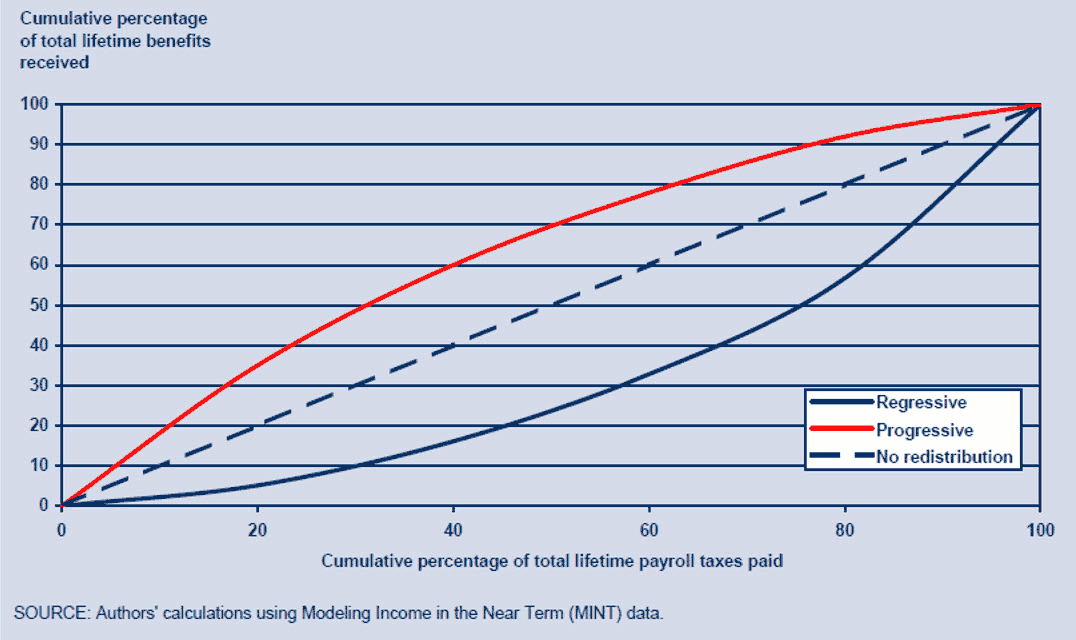
The authors conclude: “Results show that the Social Security program is modestly progressive on a lifetime basis, about halfway between a pure DC program and a program paying a flat-dollar benefit. In this way, the current program can be described as balancing its twin goals of income adequacy and individual equity.”[21]
Conclusion
In concluding, I endorse the conclusion of Biggs et al., quoted immediately above, that the current Social Security program does a reasonable job of balancing adequacy and individual equity, but repeat my own view that it barely achieves adequacy: Reforming Social Security should mean increasing funding, not cutting benefits.
Looking Ahead
In forthcoming articles, I shall look to European efforts at reform (and some of the pitfalls along the way) to attempt to gain insight into a program of US Social Security reform that is both sustainable and achievable.
Statements of fact and opinions expressed herein are those of the individual authors and are not necessarily those of the Society of Actuaries, the newsletter editors, or the respective authors’ employers.
Paul Donahue, FSA, is a lawyer and actuary who works in New York City. Paul can be contacted at pauljdonahuefsa@aol.com.