
Several Ways to Improve Your Use of Excel for Actuarial Production
By Stephan Mathys
Small Talk, June 2021

This article is a follow-up to “Several Reasons Excel Should Not be Your Production-level Actuarial System.” In that article, I pointed out some known flaws of Excel: it is a blank slate, it wasn’t designed for presentations, version control stinks, and more.
However, as Excel has infiltrated virtually every point of the business world, in this article I offer several ideas for how to make your use of Excel (or other spreadsheet tools) better. Inspirations include the software development life cycle, end-user design considerations, and practical business advice.
1. Introduce the Idea of “Environments” Into Spreadsheet Management
Software development separates “production” from “test” versions of a piece of code, in order that the official version remains stable and locked-down from period to period. The software process usually involves three environments: development, test and production. Development is where the programmer does a lot of “sandboxing,” to see if something might work, validate logic, etc. Test is where the end-user would be given an almost-live version of the code, to check if the results produced by the developer match the required specifications. Production is where the end-user performs business-as-usual.
Three environments is likely too much for most actuarial departments to manage. To apply the idea for spreadsheets, however, requires only two environments: test and production. This could be as simple as creating different folders on a network drive.
Test will encompass both development and test activities from above. Separating environments like this can be a good way to ensure that untested, unvalidated changes don’t accidentally slip into the official spreadsheet.
As such, you can create a process to ensure that requirements have been met before changing the spreadsheet in the production environment. This checklist could include items like, “Have all defined ranges been updated? Have any instructions for use been updated? Does the [INDEX] reflect the current population of tabs?”
Also, consider an archive folder as a subset of the production directory, which may use a file naming convention to indicate when it was moved out of production into the archive. This way you can have ready access to prior versions if a change accidentally slips past your testing. Also, it creates an audit trail of which version created values during a specific time period.
Before changing the function of the spreadsheet, first back up the current official version to the archive folder with a name that reflects the version and date. Then make a copy of the official version into your test folder and play around. When you’ve got what you think is a good change, get some review. If the version is good to go, migrate your newest version from test back to production.
2. Create Unique Sheets for Various Components
Separate [INPUTS] from [CALCULATIONS] from [OUTPUTS] and include sheets for [INDEX], [INSTRUCTIONS], [CONTROL], and [REPORTS].
Many actuarial spreadsheets reference values in a different workbook inside a formula and end up looking like this:
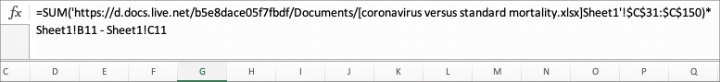
The challenge here is the requirement to know that the data link must be updated for the formula to update. Data references sourced from other locations should be split out and given their own tab, so that those who are operating and maintaining the spreadsheet can understand and track what inputs need to be changed each period.
[INPUTS-LINKS] can be those links referenced inside the formula above. However, I don’t recommend using actual links to files. Instead, copy-paste the data into your worksheet and store the reference information. Because links can be unstable, pasting the data and noting the link minimizes the risk of data integrity degradation. Structure this sheet with all of the relevant information on the left, and the data on the right. This will make it abundantly clear what the source is and what the value is.

[INPUTS-EXTERNAL DATA] will be similar to [INPUTS-LINKS]. This tab will list all the data that comes from an external source. This might include macroeconomic factors (US Treasury rates), partner inputs (such as inventory from a supplier), or other values that are not maintained internally by the company and must be manually updated.
[CALCULATIONS] should be the bulk of the mathematical operations. It should only reference the [INPUTS] sheets and have a consistent look and feel to all the calculations, for clarity, auditability, and ease of modification.
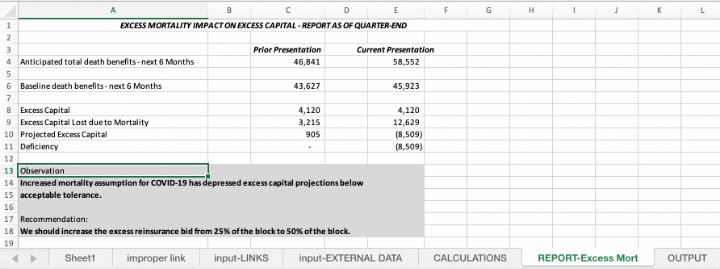
[REPORT—[report1, report2, report3, etc.]] In these various reports, you will make summaries of the calculations on [CALCULATIONS] sheets. In a pricing model, you might have a separate report for policy cash flows, one for reserve analysis, one for surplus, and more. This is a way to create an ingestible presentation of the calculations, and should be the exhibits that you reference during discussions about the impacts of the model’s calculations.
[OUTPUTS] should be a stand-alone sheet and is used when other, downstream files collect information from this file and store it in their respective [INPUTS-LINKS] tabs. Separating out the values here will give those downstream users confidence that they are pulling the right information. As well, it allows you to change the rows and columns under the hood in the [CALCULATIONS] tab or redesign the [REPORTS] tab you are referencing without affecting the data transmission process.
[INDEX], [INSTRUCTIONS] and [CONTROL] are self-definitional. Your [INDEX] tells what is inside the workbook, the [INSTRUCTIONS] explain how to use it (including how to use any macros or automations), and [CONTROL] may include any sort of feature toggles you wish to allow the user to define.
3. Create a Consistent Structure for Calculations
When spreadsheets are created ad-hoc, the usage of time steps tends to be inconsistent: advancing by rows in one sheet, columns in another, and even a mix of the two in the same sheet. Sometimes steps will be weeks, other times months, quarters, or years. This is confusing for users and reviewers, leads to low trust, increases the time for updates and audits, and adds to the risks of the spreadsheet.
A better way is to make all calculations follow a consistent layout, either across rows or columns, and use that layout for all calculations, regardless if it requires a few more rows or columns. For example, one way to make calculations consistent is with time steps going across the columns and each individual calculation going down the rows:
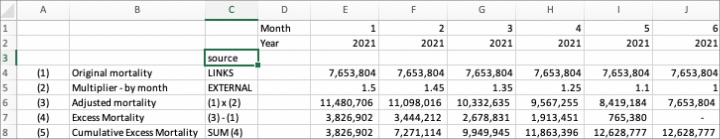
Creating a consistent structure will improve auditability of the calculations and enable better, easier reporting.
4. Make Each Cell One Thing and One Thing Only
This is complementary to the advice for consistent structure to the calculations. You might have noticed that the calculations above are very granular—that is by intention. Each has been broken down to its smallest part. It is in high contrast to the intricate formulas often found in actuarial spreadsheets, which can include nesting of functions, lookup ranges, and data transformations within other formulas. Such practice makes for efficiencies within a cell, but is an incredible pain to validate and audit afterwards.
Formulas should not include multiple nesting of IF-THEN conditions, VLOOKUPS, or range definitions. They most certainly should not have hard-coded values such as multipliers, factors, or assumptions.
A spreadsheet designer could have created the exact same formula for excess mortality in one cell, and even created dynamic ranges for it so that it adjusts to copying and pasting from one cell to another as the workbook is built.
Better practice is to split each multi-step formula into as many pieces as necessary to easily see the components of each formula. When you do this, you can adequately trace which elements are leading to errors or inconsistencies when results don’t look like you expect.
5. Use Named Ranges for Output References
Make the names intuitive. Whenever you open a downstream file, change the references away from static rows and columns to the reference name. This practice enhances stability and improves auditability. Now you don’t have to reference column J, row 8, and worry that the reference may change if the calculations underlying it expand or contract. Actuaries are often good at using named ranges within spreadsheets. I encourage this use for transferal of data to external locations as well.
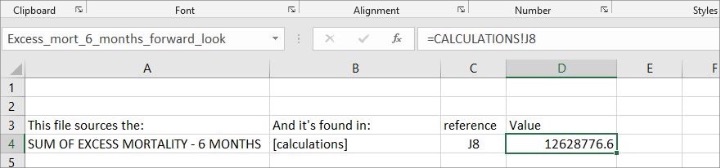
You can see that this reference, in the current highlighted cell D4, is called “Excess_mort_6_months_forward_look.” When downstream files need to reference this value (on their [INPUT-LINKS] tab, remember), they will be able to refer to this name, rather than a fixed cell.
6. Seek Constant Incremental Improvements
You won’t get there all at once. The important thing is to recognize that you will be continually improving your spreadsheets (for adding new products, reporting under new regulatory regimes, or analyzing the impact of potential portfolio management actions). Having a better structure around how you will do that should improve your process, and your job satisfaction, immensely.
I recommend starting with a redesign of your folder structure so that you have at least production and test versions of spreadsheets and an archive of historical versions. This is the easiest to accomplish as it works with your existing setup and does not require wholesale design changes.
Once you are comfortable with that separation, begin working on redesigning your calculations within a worksheet. Work to separate inputs from calculations, and then create a structure for output sources. After that, you can split out all your nested functions and get each thing down to being just one thing and one thing only.
If you would like additional spreadsheet standards and ways of thinking about these issues, I encourage you to check out the “Best Practice Spreadsheet Modeling Standards” originally published by the Spreadsheet Standards Review Board. These standards were written for public use to help guide spreadsheet development and include many more ideas and guidelines than I have been able to introduce here.
7. Remember, You’re Not Just Doing This for the Job. You’re Doing It for Future You As Well.
Ultimately, you won’t be working on this spreadsheet any longer. You won’t always be around, because you’re hoping to move on to bigger and better things, right? At the very least, a comfortable, guilt-free retirement. A former boss once said, “If you’re not replaceable, you’re not promotable.” You want to be replaceable, so building additional functionality and comprehensive documentation into your spreadsheets now so you can move on to that next stage of life with confidence and a solid reputation.
Consider what elements of the process or the spreadsheet you just know because you’ve been using this spreadsheet for so long. Unfortunately, other users don’t have that same inside information. It is incumbent on you then to document that critical information for their future use. It’s better to have documentation and not need it than to need it and not have it.
If you need additional justification to adopt better standards and principles for working with spreadsheets, consider this: Suppose your new spreadsheet practices enable you to improve your actuarial work so much that your company grows to need some commercial software to replace one or more aspects of your current spreadsheet work. Wouldn’t that conversion project be a dream if everything you want to do in that future system is already atomized, properly laid out, and documented within your existing spreadsheets?
Conclusion
These ideas require no external consultant projects or new software, so should be on-budget and immediately implementable. They do, however, require intentionality, practice, and a bit of grace as you work your way up the learning curve.
As you perform marginal improvement on your spreadsheets, you will likely find that your deliverables are easier to produce, more robust, understandable, and your time spent on audits or rework diminishes. As a result, you should see additional trust in your actuarial work, which should lead to a positive return on investment, easier adoption of your recommendations, and better risk management outcome for your company.
Statements of fact and opinions expressed herein are those of the individual authors and are not necessarily those of the Society of Actuaries, the editors, or the respective authors’ employers.
Stephan Mathys, FSA, is an independent actuarial consultant who works to improve models, processes, and communications. He can be reached at mathys.stephan.j@gmail.com.