
Data 101
By Brenna Gardino
Small Talk, September 2021

As actuaries, we are familiar with the basic components of a model: Model Input, Calculation Engine, and Model Output. We tend to focus on model validation which is a review of Model Output. Frankly, model validation is fun, and our audience is always keen to receive model output and results as soon as possible. But… there is a level of responsibility to ensuring that what goes into the model is not garbage. The “garbage in, garbage out” phrase is very cliché and very true. You can have an incredible calculation engine with validated model output and also have something that is completely useless based on what went into the model.
Not only does bad data make a model useless, data is increasingly important, scrutinized and visible. Accounting Standards Update (ASU) No. 2018–12 (commonly referred to as GAAP Long-Duration Targeted Improvements or GAAP LDTI) increases the importance of data. For traditional business, companies will now be using a company’s actual history/data in the calculations of reserves and DAC. The ASU also brings new disclosures into play which allow others (inside and outside of a company) to see an actual to expected comparison.
Background
As background, model inputs can be organized into three general groups with overlap among them:
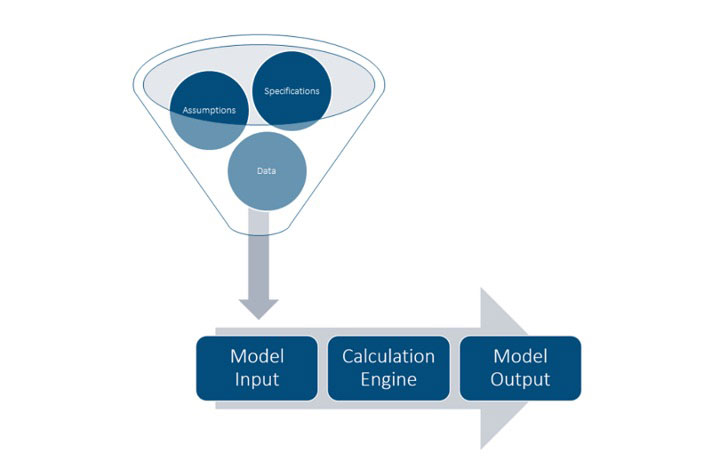
Specifications
Specifications are not always thought of as data, but they are a model input and sometimes sourced from data. These can be thought of as non-negotiables meaning they’re “facts” or come from rules. Specifications examples include a percent of premium charge that is specified in the contract between a policyholder and the company or an item like a statutory reserve interest rate.
Assumptions
Assumptions are an area that is heavily reliant on judgement with the judgement not necessarily made by the modeler. Assumptions often start with a review of data (either corporate or industry) and then the development of a long-term view. Assumption examples include policyholder behavior such as surrenders, conversions, and withdrawals. Additional assumptions include mortality and improvement, new business, maintenance expense, or economic environment assumptions such as inflation, defaults, and earned rates.
Data
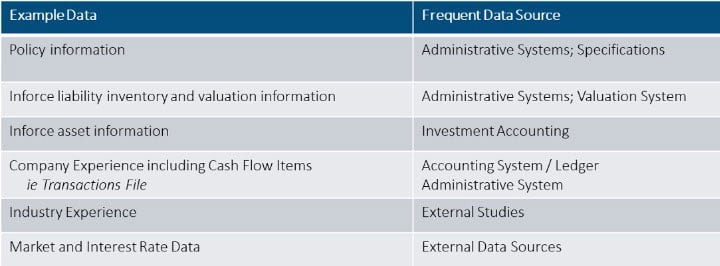
Some actuarial data is reviewed and serves as a basis for an assumption. Often, data is also directly input into the model. Administrative systems are frequently a source of truth with more than one administrative system per company being common and adding complication. A corporate accounting system/ledger also provides company experience such as premiums, commissions, and death benefits. Several of these data items occur in a few corporate systems and can be sourced from either the administrative system or an accounting system. Multiple sources can be helpful in assessing the validity of values but also adds a layer of complexity due to inconsistencies. While valuation/projection systems are inherently calculation engines, they also function as a data source.
Getting Comfortable with Your Data
Several data validation techniques are helpful to assess the quality of your data. Start with assessing general reasonableness. This can be done using something as simple as Excel and digging into key fields to review variations, totals, and relationships with other fields. Consider your expectations of the data and what population definition you expect. You should also be prepared for “bad data.” Blanks and non-sensical numeric values are likely. It is good to quantify these and understand what your model does with them. Consider any data cleansing or simplification that is performed and monitor imperfect data over time.
The bulk of data validation occurs via comparisons or reconciliations.
- Comparison to prior versions of data. An example is the inforce block of business for Cash Flow Testing. You can review whether the company has the same general mix of business from year to year (attained age, sex, risk class, average size, product mix, overall counts, etc.). A change could indicate a data issue, or the change could be completely correct and require a review of the appropriateness of assumptions and the model.
- Cross-compare. Most data is captured by a couple of systems. The company’s experience study data should be fairly consistent with the data that is used LDTI. Review what the experience study team show for amount of deaths in the past year vs what the model has. Review how the historic data looks compared to the model projection. This is part model validation but also serves as good data validation. The goal is to have a consistent data “story” on a given item across company, systems, and applications.
- Reconciliation. View your data with a control mind set. A simple example is the number of policies that should be in valuation. An outside user should be able to start with the administrative system and trace through the valuation extract creation, the import into model, any calculation errors, any export from the model, to result/report creation and finally the company’s financials. It is not a requirement that everything match, but you want to construct a list of valid reasons why things do not match. Flow charts are particularly helpful on reconciliation. Not all data management systems are created equal. Most of them assume the data coming in is perfect, and the models use it accordingly. Others have built in reconciliation tools.
Data Validation Lessons
Data is messy and large and can be intimidating, but a few guiding lessons are good reminders on any project.
- Doubt things. Yes, I’m saying to be an inquisitive skeptic and convince yourself that the data you have will work.
- Develop a gut. As a young actuary, it was frustrating to me when an experienced actuary spotted something wrong immediately on a project. Gut development comes with time. It requires a conscious effort to understand how the pieces work plus a retention of strange data stuff you’ve seen in the past. The odds are high that you will see something similar in the future and be able to solve it that much faster.
- Do not expect perfection. See #1 if you encounter perfection. Any process, especially a time-sensitive one such as financial reporting, cannot let perfect be the enemy of good. Once you have a level of comfort with your data, do not spend excess time on immaterial items that do not change the big picture. Instead…
- Document, document, document. During validation, your brain is smarter on a given data source at that moment than it likely ever will be again. Write a memo to your future, less smart self in preparation. Include the different validations you performed and your findings. Include areas that may warrant additional research at a future point (the gap between good and perfect). Include materiality, simplifications, and process thoughts.
- This really should be number 0. Read ASOP 23 (Data Quality), and read it often. It’s short and has helpful thoughts on reviewing and using data plus communication regarding data.
Statements of fact and opinions expressed herein are those of the individual authors and are not necessarily those of the Society of Actuaries, the newsletter editors, or the respective authors’ employers.
Brenna Gardino, FSA, MAAA, FLMI, is principal & director of consulting at Actuarial Resources Corporation. She can be reached at brenna.gardino@arcval.com.